Past Features
This page lists out the IEM Daily Features for a month at a time. Features have been posted on most days since February 2002. List all feature titles.
Mon Aug 01, 2022

50 days to get Two Inches
01 Aug 2022 05:30 AM
The dryness this summer continues to be of great concern and with hotter temperatures this week, the impacts will quickly grow. The featured map presents the number of days one needs to travel back in time before accumulating at least two inches of rainfall based on NOAA MRMS precipitation estimates. Southern Iowa is certainly of worst off on this map with the brown splotches representing at least 50 days to accumulate those two inches. There are at least chances of rainfall in the forecast, but nothing looks too widespread and the heaviest totals will mostly stay off to Iowa's east.
Voting: Good - 15 Bad - 0
Generate This Chart on Website
Tue Aug 02, 2022

Year of Last 100
02 Aug 2022 05:28 AM
While previous forecasts were more bullish on portions of Iowa seeing 100+ degree highs this week, the current forecast over the next two days has slightly "cooler" temperatures forecast. The trade off is that the humidity will be on the dramatic increase with heat index values above 100 degrees instead. So it is a good time to dust off the map showing year of last 100+ degree high temperature for the NWS long term / COOP sites tracked by the IEM. The map shows some micro-climate effects as some sites have not seen 100 degrees for over 20 years while others have had much more recent occurrences. Humidity levels play a roll in this map as local increases in humidity change the energy budget and effectiveness of daytime heating in warming the lower atmosphere.
Voting: Good - 13 Bad - 0
Tags: 100
Wed Aug 03, 2022

Peak Dew Point
03 Aug 2022 05:31 AM
It was ugly hot in Iowa on Tuesday with heat index values well above 100 degrees thanks to air temperatures well into the 90s and dew points in the 70s. The month of August is still squarely within the summer months for Iowa, so such weather is not a surprise. The featured chart looks into the date of the year for Des Moines with the highest dew point temperature. The value for 2022 was set at 77 degrees back on 13 June, so that was not quite exceeded Tuesday evening. The bottom left panel shows a fare amount of spread for when the peak dew point temperature occurs, but it is generally found during the peak crop transpiration time in July and early August.
Voting: Good - 9 Bad - 0
Generate This Chart on Website
Thu Aug 04, 2022

August Hourly Records
04 Aug 2022 05:30 AM
While not an official weather metric that the National Weather Service tracks, the IEM maintains a database of hourly airport weather observations. The featured chart shows the warmest hourly observations from the Des Moines airport during the month of August. The extremely warm and muggy overnight on Wednesday set a new August record of 83 degrees at 7 AM and tied at the same value at 8 AM. Such hot and steamy conditions overnight are very dangerous as un-airconditioned buildings and livestock will struggle to cool off to recover from the day time heat. Conditions will be cooler on Thursday with over night temperatures back to comfortable levels, which again helps to make things a bit more bearable.
Voting: Good - 9 Bad - 0
Generate This Chart on Website
Fri Aug 05, 2022
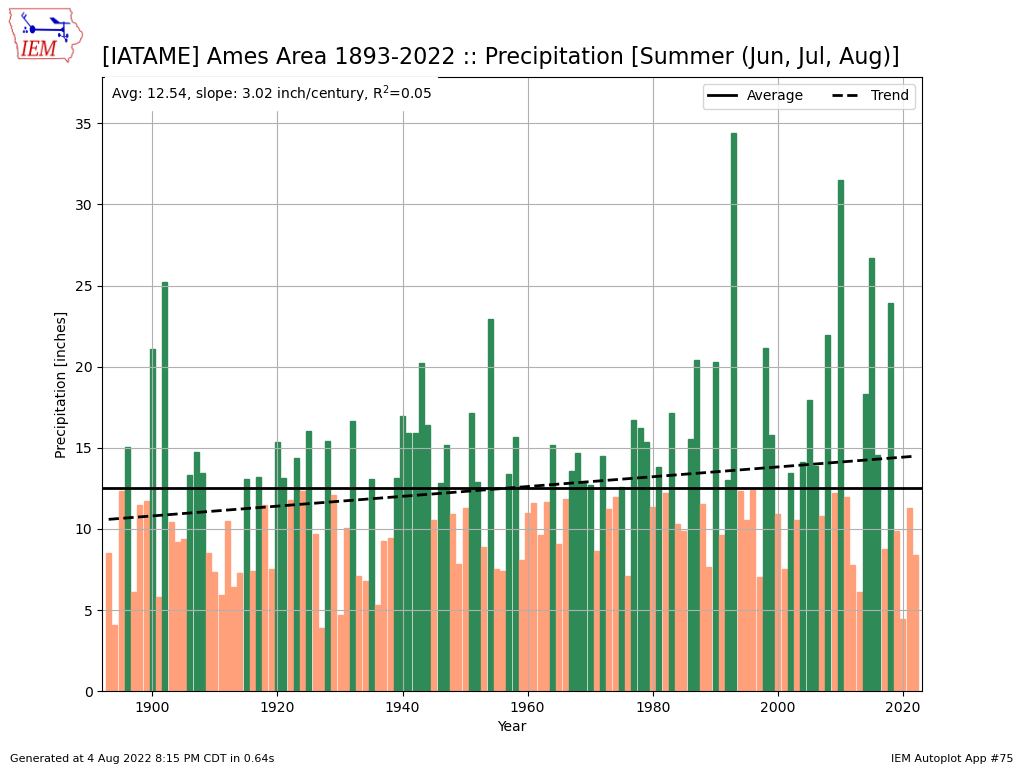
Summer Season Precipitation
05 Aug 2022 05:30 AM
Precipitation has been difficult to come by for much of Iowa this summer. The just released US Drought Monitor update had significant deterioration, specifically over southern Iowa. Summer in Iowa tends to either feast of famine for precipitation as both extremes tend to increase their respective extremity with dry conditions limiting moisture and thus storms, with the opposite situation having the opposite effect of more storms increasing moisture and increasing future storm chances. An illustration of this feast of famine can be found with the featured chart plotting summer season (Jun-Aug) precipitation for Ames. This year continues the past three years being below average. The long term linear fit trend is upward, but the fit is not statistically strong and being pulled upward by the wet years of 1993 and 2010.
Voting: Good - 12 Bad - 0
Tags: summer
Generate This Chart on Website
Mon Aug 08, 2022

Sioux Falls Record Rainfall
08 Aug 2022 05:35 AM
'Tis the season for extremely heavy precipitation events. The atmosphere is loaded with moisture and overnight storms are fed by expansive reservoirs of humid and unstable air by the low level jet. Storms do not move very fast thanks to limited winds aloft and tend to back build / train over top the same locations producing prodigious amounts of rainfall. You may recall the record rainfall event two weeks ago for St Louis. On Sunday, it was Sioux Falls turn with 5.44 inches reported for the day. The featured chart presents the maximum daily totals by month for the site. Yesterday's event bested the previous high of 4.59 by a comfortable margin. Iowa has seen its share of localized and heavy rainfall events over the past few days. The rainfall is certainly welcome and likely able to help the corn and certainly help the soybeans that are both at critical stages for yield potential.
Voting: Good - 9 Bad - 0
Generate This Chart on Website
Tue Aug 09, 2022

Southern Iowa Drought
09 Aug 2022 05:30 AM
While NW Iowa has seen the most persistent drought this year, the situation over southern Iowa is rapidly deteriorating. This week's update to the US Drought Monitor considers rainfall or lack thereof up until Tuesday morning. The featured chart presents NOAA MRMS estimated departures from average over the past week. It is rather amazing to see the alignment between this product and the most recent drought monitor analysis. Only some portions of far north central Iowa saw significant rainfalls over areas analyzed in drought status. Much of the past week featured scorching heat, which further increases the impact of little rainfall.
Voting: Good - 11 Bad - 2
Generate This Chart on Website
Wed Aug 10, 2022

Sioux City Struggles
10 Aug 2022 05:30 AM
Precipitation has been a struggle this summer over much of Iowa. For parts of NW Iowa, the struggle has been real for the entire calendar year as shown by the featured chart of year to date accumulated precipitation. The red line is this year's accumulation and is shown at the bottom of the range of values for the date. Rewording, the year to date accumulation this year is the lowest on record for the site at just over nine inches. The wettest and driest full year is plotted as well along with the present NCEI climatology. It is too bad that all that rain that fell just north over Sioux Falls on Sunday could not have been shared a bit further south.
Voting: Good - 15 Bad - 0
Tags: 2022
Generate This Chart on Website
Thu Aug 11, 2022
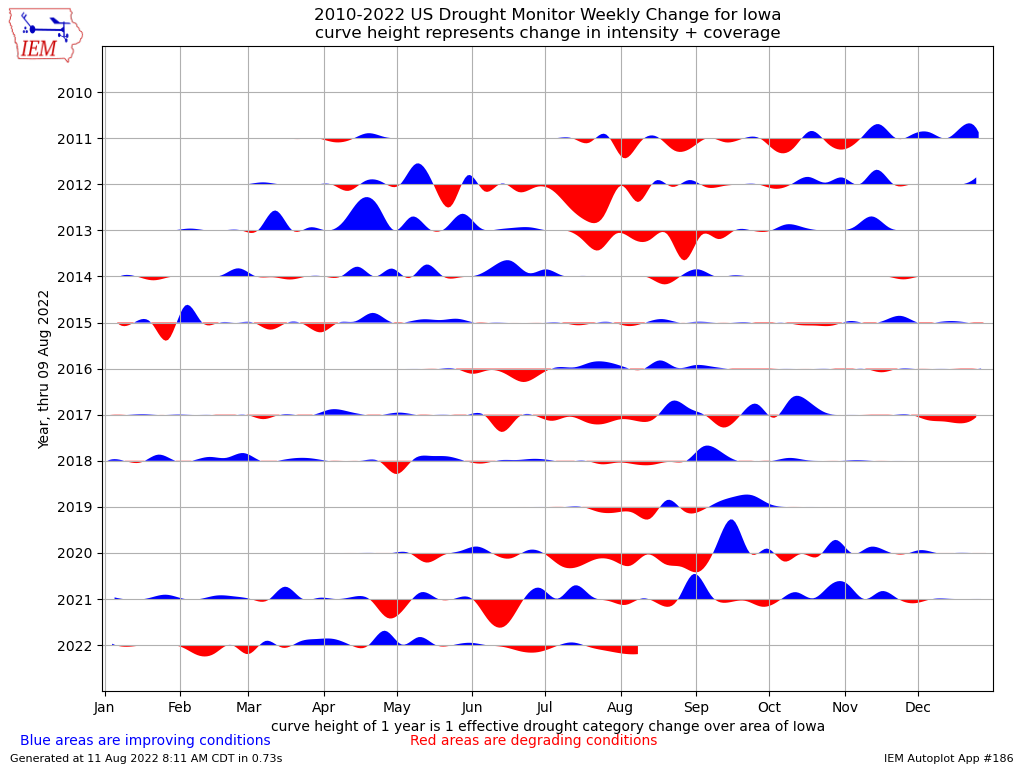
Changes of the Drought Monitor
11 Aug 2022 08:17 AM
The weekly update to the US Drought Monitor was just released and while there were small improvements made to the analysis over northern Iowa, much of southern Iowa saw a significant degradation. The featured chart presents a smoothed analysis of the week to week changes in areal coverage of analyzed drought over the state since 2010. The areas in blue indicate net decrease in drought coverage and red indicate an increase. The unit magnitude of the plot is the area of Iowa. July and early August are certainly a favored time of year for increasing drought as rainfall events decrease and become more localized. The last few years have seen significant rains show up in late August and September, will the same happen this year? Current forecasts are not very optimistic for the next few weeks of August.
Voting: Good - 8 Bad - 1
Generate This Chart on Website
Fri Aug 12, 2022
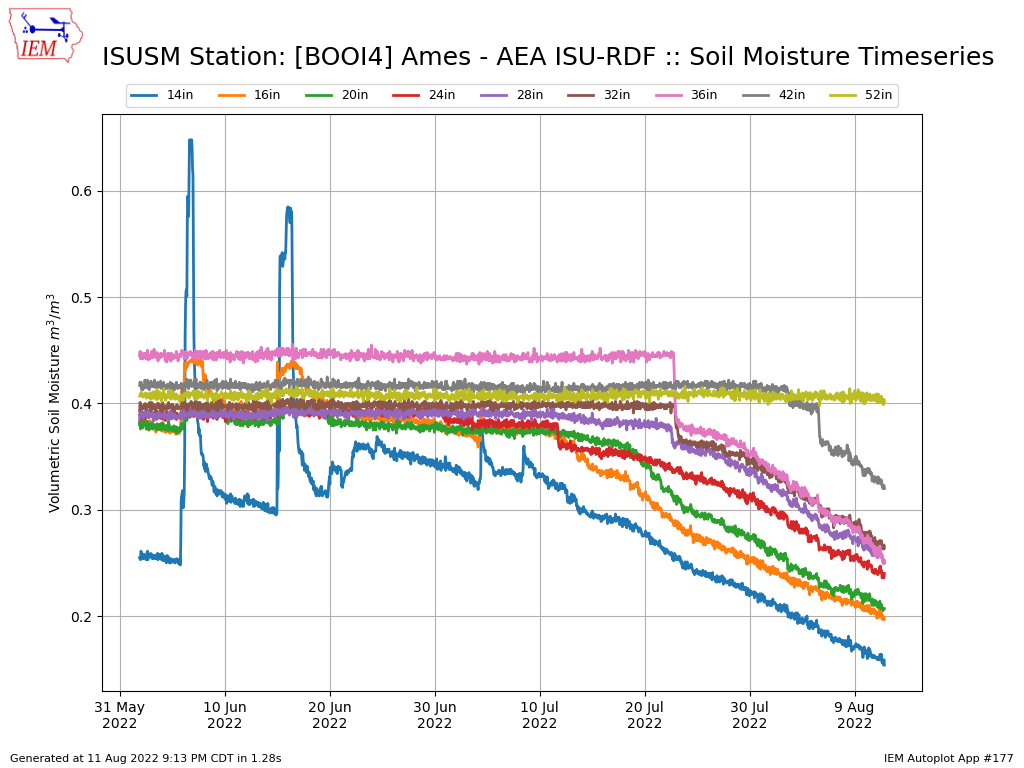
Soil Water Removal
12 Aug 2022 05:30 AM
The featured chart presents a time series of observed soil moisture from the ISU Soil Moisture station near Ames. The sensor is buried in a soybean field with sensors at the denoted depths below the ground surface. The chart nicely shows the depletion of soil water with time as the layers start drying sequentially with depth. This nicely shows the advancement of the crop roots as they grow deeper and tap moisture available at that level. You may notice that the 52 inch value is just starting to tick downward. This site has not been too bad off for drought conditions this year, but has recently been very dry and certainly could use more rainfall to help the crops reach yield potential.
Voting: Good - 11 Bad - 1
Generate This Chart on Website
Mon Aug 15, 2022

2022 Daily VPD
15 Aug 2022 05:30 AM
The featured chart presents daily climatology and 2022 values for vapor pressure deficit. The bottom panel shows the departure from a simple daily averaged climatology. This value is useful for diagnosing the magnitude of "suction" or "pull" the atmosphere exerts on plants for water. Drier and warmer temperatures will demand more water than cooler and more humid conditions. While a small positive of the ongoing drought conditions this summer is the lack of persistent muggy weather, the big downside is that vegetation struggles to retain water and smaller reservoirs of water are dried up. The daily departures this summer for Ames show many days since mid June with above average VPD values (implying an increased demand of water from the atmosphere).
Voting: Good - 12 Bad - 0
Tags: vpd
Generate This Chart on Website
Tue Aug 16, 2022

We will take every drop
16 Aug 2022 05:38 AM
It was a beautiful rainfall on Monday that lasted into Tuesday morning for southwestern Iowa. Unlike many previous rainfalls that were focused over the northeastern half of the state, this event hit some of the most drought stricken areas of western Iowa. The featured map presents the combination of most recent US Drought Monitor and NOAA MRMS precipitation estimates for Monday. The area near Sioux City was the biggest winner this time with the airport there reporting just under two inches of rain. The rainfall rates were gentle with this event, so the vast majority of the rainfall likely infiltrated the ground.
Voting: Good - 15 Bad - 0
Generate This Chart on Website
Wed Aug 17, 2022

Two Inch Rainfall Impact
17 Aug 2022 05:30 AM
Sioux City's rainfall woes have been the subject of a number of IEM Daily Features this year. The airport picked up almost two inches of much needed rainfall on Monday. Did the rainfall put a dent into the deficits for the location? The featured chart presents six different trailing day precipitation metrics. The values represent the given x-axis date until Tuesday. Of course, the impact of the event on the very near recent term is significant as a two inch rainfall will far surpass climatology. But as one starts traveling back in time to early June and even to April, there are still substantial deficits to make up. The US Drought Monitor from last week has the location at D3 classification. Note that the Drought Monitor is representative of larger areas than just a point, but point data is considered in the analysis. So while the two inch rain may help boost the area to D2 classification for this week's update to be released on Thursday, significant deficits still remain and more rainfall would certainly be welcome!
Voting: Good - 10 Bad - 0
Generate This Chart on Website
Thu Aug 18, 2022

August Dew Point Percentiles
18 Aug 2022 05:41 AM
After some hot and muggy weather to start off the month, the past week to ten days have seen rather pleasant August weather with comfortable temperatures and dew points. The featured chart presents August dew point percentiles for Ames. The top panel shows the percentile climatology by hour and needs some plotting help to make it more useful! The bottom panel is more interesting and displays the hourly dew point percentile values this year during August. The percentiles are computed for each hour of the month. The side panel on the bottom plot shows a histogram of these values which gives an indication of the amount of time Ames has spent at a given decile range this month. So the moral of the story here is that we have majority of time this month below the 50th percentile for dew point.
Voting: Good - 10 Bad - 0
Tags: dewpoint
Generate This Chart on Website
Fri Aug 19, 2022

Ames D1 Drought
19 Aug 2022 05:23 AM
The weekly update to the US Drought Monitor was released on Thursday with some locations in central Iowa, like Ames, degraded to a D1 (Moderate) drought classification. This degradation is due to a "flash drought" situation as this area has seen an abrupt change from adequate precipitation to very little during a high water demand period of the year. The featured chart nicely illustrates this change with trailing 31, 91, and 365 trailing day precipitation departures plotted in units of standard deviation. The coincident drought monitor classification is underlain. The rapid drop off in 31 and 91 day departures is juxtaposed with one year departures still well above average. It is getting very late in the growing season for rainfall events to make a difference for rapidly maturing crops, but any rains that do come soon will help!
Voting: Good - 17 Bad - 0
Generate This Chart on Website
Mon Aug 22, 2022

Fair Weather Heat
22 Aug 2022 05:30 AM
While the Iowa State Fair got off to a hot start two weeks ago, very pleasant weather dominated most of the ten day event outside of some downpours on the second Friday afternoon. The featured chart presents an IEM calculated frequency of hourly temperature readings of at least 80 degrees during the days of the fair each year based on Des Moines Airport readings. The 2022 total comes in well below the simple long term average and lowest total since 2014. Attendance numbers for the fair were certainly helped by this nice weather with the last Saturday setting a single day attendance record for the event.
Voting: Good - 8 Bad - 0
Tags: statefair
Tue Aug 23, 2022

Visibility Climatology
23 Aug 2022 05:30 AM
Patchy dense fog has been present over Iowa these past few mornings. The featured chart presents a climatology of visibility reports from the Des Moines Airport being less than a mile by hour of the day and week of the year. While frequencies are small, the hours around sunrise this time of year have a slightly elevated frequency versus recent summer months. This time of year features increasingly longer nights allowing for more cooling and near surface moisture from mature vegetation that combine to allow temperatures to reach 100% humidity and fog to form. The decrease in wind speed as well also contributes as less mixing happens in the lower atmosphere.
Voting: Good - 10 Bad - 0
Tags: visibility
Generate This Chart on Website
Wed Aug 24, 2022

Ames Aridity
24 Aug 2022 05:38 AM
Aridity is an index value that attempts to combine average temperature and precipitation data into one value. It is computed by subtracting the precipitation departure from the temperature departure. The departure is measured in units of sigma (standard deviation), which allows for the two departure values to be combined as they have the same units. Increasing positive values indicate more water stress and negative values the opposite. The featured chart presents this metric computed for Ames over three different day intervals. This chart shows the "flash drought" nature of what Ames has recently experienced as a quick transition from less water stress to more water stress has happened over the past two months.
Voting: Good - 11 Bad - 0
Generate This Chart on Website
Thu Aug 25, 2022

Area Forecast Discussions
25 Aug 2022 05:30 AM
The IEM website has a massive archive of National Weather Service text products. Among these text products includes something called the Area Forecast Discussion (AFD), which is a technical narrative discussing some of the "inside-baseball" aspects of the weather forecast. The featured map presents the number of these products issued per weather forecast office so far this year. There's quite the variance between offices as each office has freedom to tailor the product to their partner's needs and some offices routinely update the product while others stick closer to twice per day issuance. You can find the most recent AFDs for Iowa' WFOs at the following links: Des Moines, Davenport, LaCrosse, Sioux Falls, and Omaha.
Voting: Good - 8 Bad - 0
Generate This Chart on Website
Fri Aug 26, 2022

Different Droughts
26 Aug 2022 05:30 AM
Producing a drought analysis is very tricky business as generating a single classification that encompasses precipitation departures over various time scales is fraught with peril. It also does not help that summer time precipitation tends to be very spatially variable as individual thunderstorms have a footprint much smaller than what the drought monitor is built to capture. The featured map attempts to illustrate this by combining the most recent drought monitor analysis and climate station precipitation departures measured over 30, 120, and 365 days. The departures are expressed in terms of standard deviation (sigma) and colored in a way that aligns with a drought monitor classification metric. So a comparison is readily apparent between the drought situation in NW Iowa and that in southern Iowa. The bulk of the significant dryness in NW Iowa is on longer time scales and southern Iowa is a much more recent / flash drought situation. In the face of conflicting precipitation metrics, it is always good to look at impacts. In this case, low river flows, dry soils, and crop stress are generally common over all the analyzed drought areas.
Voting: Good - 23 Bad - 0
Tags: drought
Generate This Chart on Website
Mon Aug 29, 2022

Sticky Air Return
29 Aug 2022 05:30 AM
Summer time humidity returned to Iowa this past weekend along with some much needed rainfall, both of which ended a rather dry and not very humid August period. The featured chart presents the daily range between the min and max dew point temperature for Ames. Any days with the max value at or above 70 degrees is highlighted in red. The chart nicely shows the humidity respite we have seen this past week or two with values well below 70. The humidity from this weekend is expected to leave the state on Monday with a return to very pleasant August conditions to end out the month.
Voting: Good - 12 Bad - 0
Generate This Chart on Website
Tue Aug 30, 2022

2022 Farm Progress Show
30 Aug 2022 05:30 AM
The Farm Progress Show gets underway today just west of Ames on Highway 30. The IEM is thrilled to have a booth at the display within the Iowa State University tent. The display location is crudely denoted with an 'X' on the featured map. Your's truly will be out there all three days, so please stop on by and give me a bad time! The display intends to highlight various weather and climate monitoring features of the IEM website and answer all the questions you may have!
Voting: Good - 13 Bad - 3