Link: https://mesonet.agron.iastate.edu/pickup/hunga_tonga/
The Hunga Tonga volcano had a powerful eruption at approximately 10:14 PM on 15 January 2022 Central Standard Time. This volcano is over 6,000 miles from Iowa, but generated a shock wave / lamb wave that propagated the globe many times over. The one minute interval pressure altimeter data from the US ASOS stations nicely captured the passage of the wave as sensors recorded small fluctuations in pressure. The IEM curates the one minute dataset and this news item summarizes the visualizations generated.
First up, a simple time series of pressure altimeter from the Ames, IA ASOS (KAMW) with the top panel showing the one minute values and the bottom panel showing a variability metric by subtracting the observation by a 15 minute centered mean value.
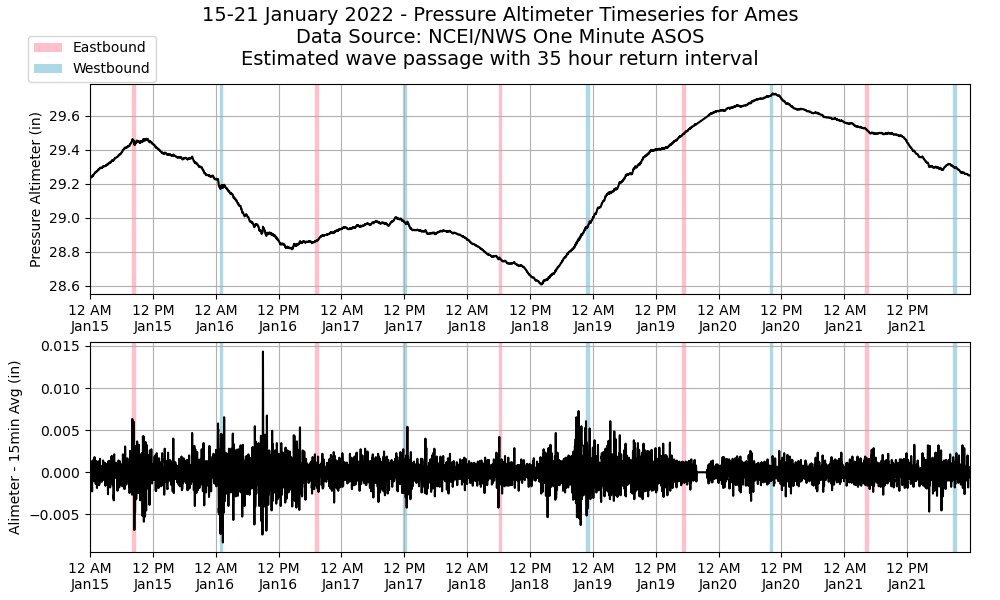
It is not entirely intuitive nor obvious where the later passages of the wave happened within this data presentation. The shaded areas are based on a static 35 hour return interval and my best estimate at the initial wave arrival.
Please keep in mind that from our perspective, there was an eastbound (moving from west to east) and westbound (moving from east to west) wave as the initial eastbound wave arrived directly to us from Tonga and the westbound wave traveled the "long way" around the globe to reach us a number of hours later due to the longer path of travel.
The lapses presented below are in the form of "spark lines" on a map, which are mini line graphs for each reporting site having one graph showing a 15 minute time series of pressure. The lines are colored based on the change in pressure over those 15 minutes. This plot type provides a nifty wave feature that your eyes can follow across the continent.
You can find these MP4 movie files for download here. Please feel free to use any of these resources how you see fit.
Eastbound Passage 1
Eastbound Passage 2
Eastbound Passage 3
I was unable to find a coherent structure within this plotting type for a fourth passage of the eastbound wave. Other analysis techniques may have found the later passages.
Westbound Passage 1
Westbound Passage 2
Westbound Passage 3
Westbound Passage 4
Westbound Passage 5
Please note that this lapse uses a 5x y-axis resolution as compared with previous lapses.