Past IEM Features tagged: wind

July Wind Antithesis
18 Jul 2023 05:30 AMThe weather on Monday featured let another day with winds out of the north, which continue to help funnel Canadian wildfire smoke through the state. Our winds this July have mostly been opposite of what climatology says should happen. The featured charts present the July wind climatology (left plot) and 2023 actual (right plot) for Ames. This information is presented in the form of a wind rose, which is a histogram oriented on a polar axis. The climatology plot indicates that southerly and southeasterly wind dominate for the month of July. This July has seen very little wind from that direction and it is rather remarkable to denote the climatology max bar at about SE is one of the shortest (least frequent) for this July. The implications are decreased humidity levels due to more northerly winds being drier and less storm activity as daytime instability is decreased.
Voting:
Good: 14
Bad: 0
Tags: wind jul23

30+ MPH Winds
02 May 2023 05:30 AMWinds were howling again on Monday with the Ames Airport weather station reporting 30+ MPH sustained winds for a couple of hours during the daylight hours. The featured chart presents the number of such hourly reports each year. This chart is plotting sustained winds, which are an average of three to five second samples over a two minute interval. The top panel shows the number of hours for the year to date period each year on record for the site and the bottom panel breaks it down by hour of the day. This year's total comes in below average and well behind the total to date for 2022.
Voting:
Good: 9
Bad: 1
Tags: wind
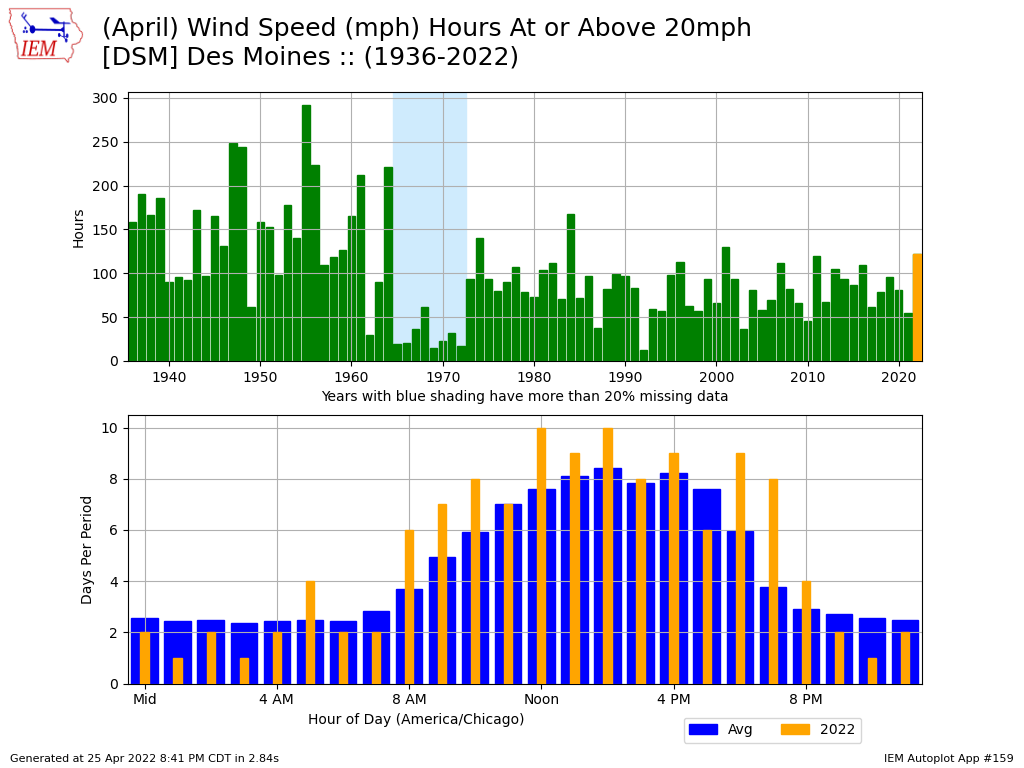
April Windy Hours
26 Apr 2022 05:30 AMYesterday's featured chart attempted to summarize this April's windiness by comparing the average wind speed vs previous Aprils. A long winded discussion ensued that such comparisons were problematic. So we are back again today with a different approach to this question of how windy this April has been by totaling the number of hourly reports each month with wind speeds of at least 20 MPH. The top panel presents the total each April and the bottom panel shows the number of days for each hour with winds speeds of at least 20 MPH. So this chart is about in the same boat as yesterday's, although there are still five days left with this April to increase the totals. So the moral of the story is the same, when compared with the recent 30 years, this year is near the top, but certainly nothing too exceptional.
Voting:
Good: 12
Bad: 0
Tags: wind

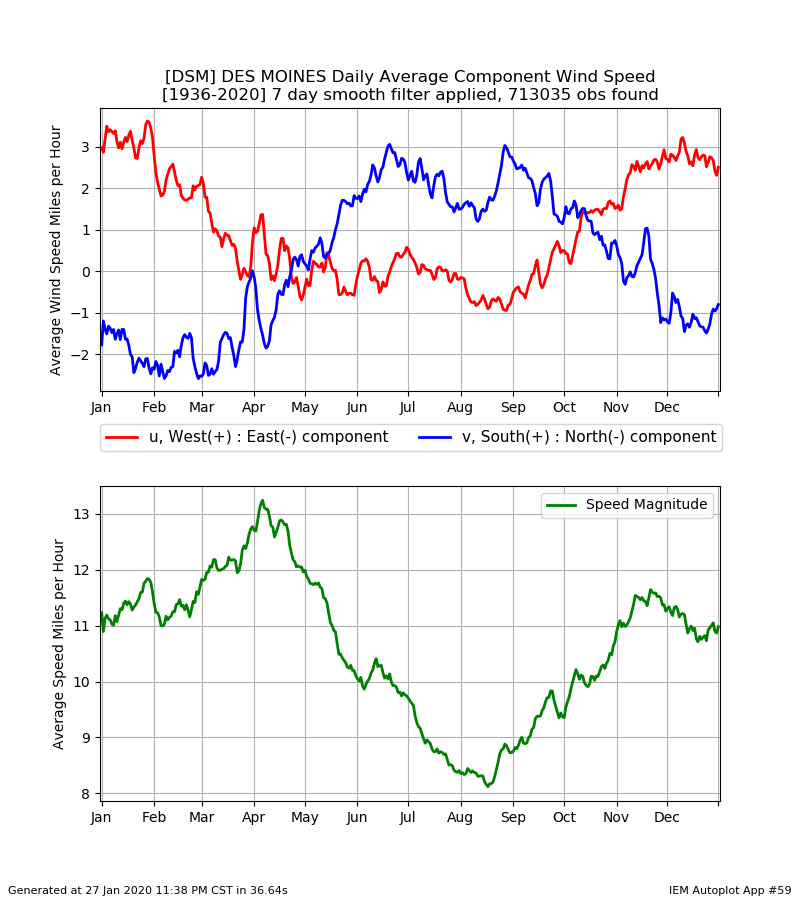
Wind Components by Day
23 Mar 2022 05:34 AMWind climatologies are often a complex topic to explore due to the multi-dimensional nature of the weather variable. While variables like temperature and humidity have single point-in-time values, wind can be characterized by both its magnitude of speed and the direction the air is travelling. As such, there is no simple and fully correct in all cases method to compute a climatology. For example, consider one report of a 10 mph wind from the north followed by another report of a 10 mph wind from the south. What's the average wind in this case? Vector averaging yields a value of zero! A more intuitive answer is that the average wind speed was 10 mph, but what was the average wind direction in this case? The featured chart presents the daily wind speed climatologies for Des Moines using the vector components for the top panel and the simple wind speed magnitude average for the bottom. Both panels show interesting aspects of the wind climatology including a clear annual cycle for wind speed. The component climatology for the top panel nicely shows the annual cycle flip between more northerlies vs southerlies and vice versa for easterlies and westerlies.
Voting:
Good: 12
Bad: 1
Tags: wind
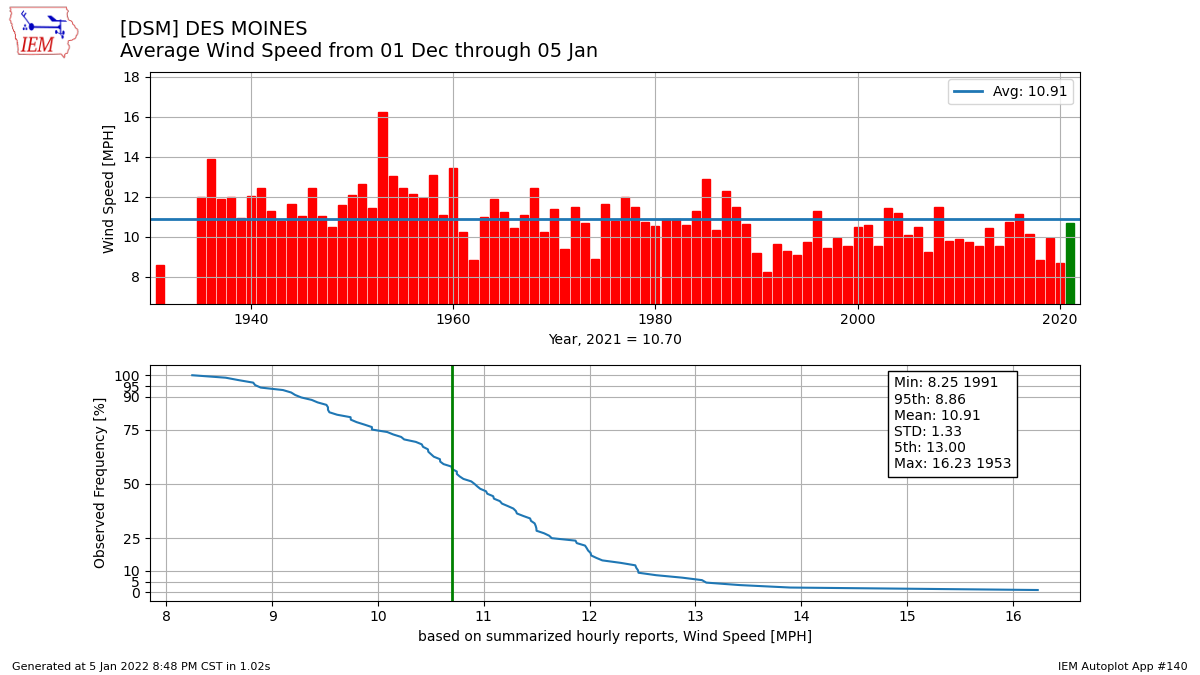
Windy Winter?
05 Jan 2022 09:13 PMWinds were howling again on Wednesday and recency bias (like my usage of 'again' just a few words earlier) would seem to indicate it has been windier than average so far this winter season. When measured by average daily average wind speed, the featured chart would seem to indicate otherwise. The chart shows the average wind speed between 1 December and 5 January for Des Moines. There are caveats galore to a chart like this including that "average wind speed" isn't really something directly measured anymore. For the modern period, what we have are hourly or better reports of two minute average wind speed over 2 or 3 second samples. Sound confusing? It gets even worse when considering the change from a more traditional cup anemometer to a two or three dimensional sonic instrument. A first glance at the featured chart would imply that the 1940s and 1950s were windier than today, but again we have to consider changes to how wind speeds were reported back then. Putting aside the long term changes, even looking back just 10-20 years indicate that this season has not been anything exceptional.
Voting:
Good: 10
Bad: 2
Tags: wind
Peak Northerlies
28 Jan 2020 05:33 AMWinds were persistently out of the north on Monday and thus not much hope for warmer weather to get advected into the state. This time of year is about the preferred time of year for such winds as shown by the featured chart. A given wind speed and direction can be decomposed into its vector components and a climatology can be built from these values. The u-component value represents the west to east value while the v-component represents the south to north value. A negative v value indicates wind blowing from the north to the south. The sign and magnitude of the v component is a good first approximation to the temperature condition as cooler continental air is typically to our north and warmer air to our south. The optimism for spring really starts showing up in April and May as the v component value turns positive.
Voting:
Good: 7
Bad: 0
Tags: wind

Wind Component Climatology
26 Apr 2018 05:34 AMTypical weather station wind measurements are horizontal wind speed and direction. This two dimensional value can broken apart into one dimensional components. The typical convention is to express wind speeds in components oriented north/south and east/west. The "u" component is the east/west one dimensional speed and the "v" component is the north/south one dimensional speed. The featured chart presents the climatology of these two values (top panel) based on long term data from the Des Moines Airport weather station. The bottom panel is the simple average of the magnitude of the wind speed. This type of plot tells an interesting story about the "v" component wind. This wind is typically responsible for the warm and cold air mass transport into Iowa. The plot shows a clear annual cycle between northerly winds (negative v) during the cold season and southerly winds (positive v) during the warm half. The transition from northerly to southerly happens about this time of year! Of course, not every day during the warm season experiences southerly winds, but when you average all the data out it is southerly.
Voting:
Good: 9
Bad: 0
Tags: wind

Second Windiest Month
14 Mar 2018 05:41 AMWinds were a bit gusty Tuesday afternoon, which fits the bill for March in Iowa. The featured chart displays the monthly averaged wind speed and direction for Ames based on period of record data at the airport. March comes in as second windiest behind April. It is kind of interesting to denote the progression of average wind direction over the year. We are still in a period with prevailing northwesterly winds, so bouts of cold are more common than not thanks to that wind. Once we get into May, then the warmer southwesterlies start to dominate.
Voting:
Good: 8
Bad: 1
Abstain: 1
Tags: wind
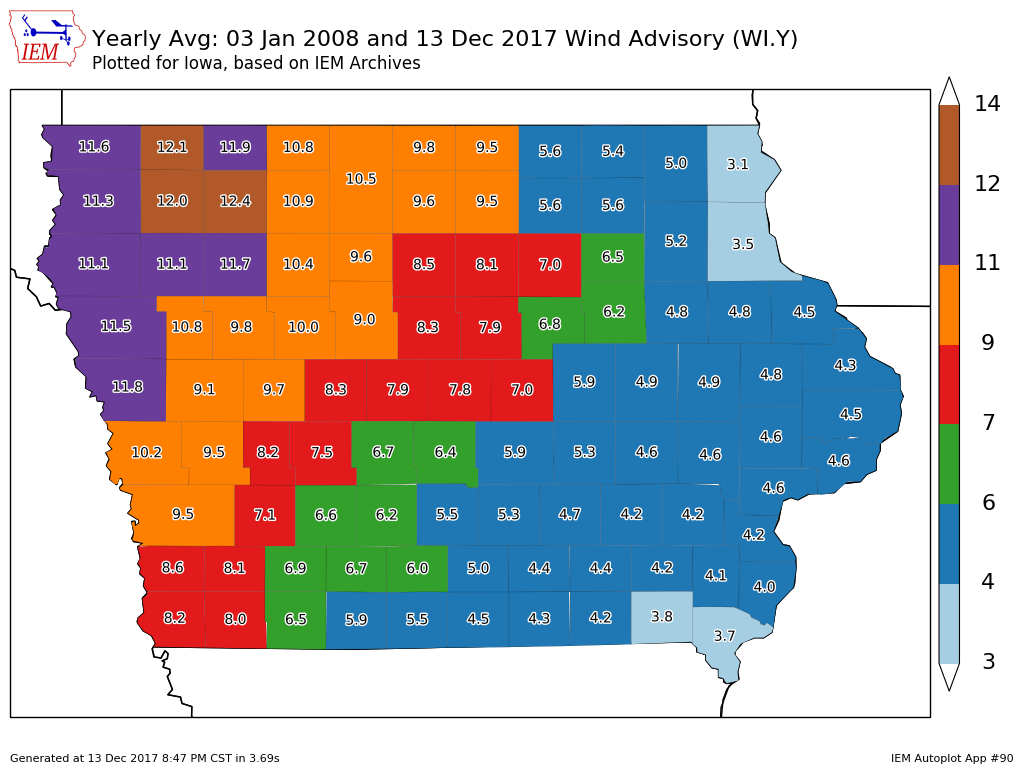
Wind Advisories per Year
14 Dec 2017 05:34 AMThe wind was howling again yesterday in Iowa prompting the NWS to issue a Wind Advisory for much of the state. The featured map looks at how common these advisories are by plotting the average number of advisories per year by county based on IEM archives. The general northwest to southeast pattern is rather clear with about three times as many issued between the extremes. Why does this difference exist? Local topography and land cover has some impact as western Iowa is flatter along with fewer trees. It is also closer to the "High Plains", which tends to be an area experiencing rapidly developing low pressure systems that help drive strong winds and drier landscapes which help mix deeper depths of the atmosphere (helps to bring stronger winds to the surface).
Voting:
Good: 8
Bad: 2
Tags: wind
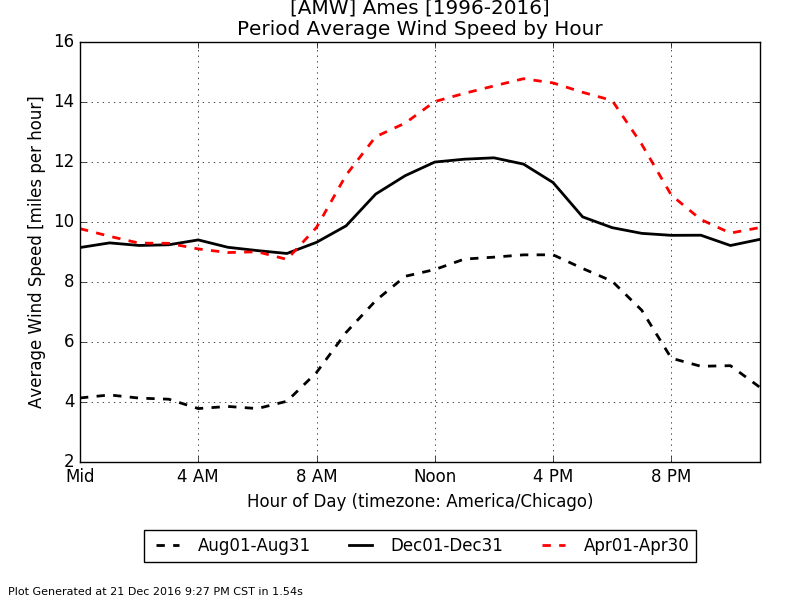
Hourly Wind Speeds
22 Dec 2016 05:36 AMWinds were gusty again on Wednesday with the highest wind speeds reported late in the evening. This is not what a typical wind speed pattern throughout the day in December. The featured chart presents hourly wind speed climatologies for the Ames Airport for the months of April, August, and December. Each trace shows the general pattern of highest speeds during the daylight hours. This is due to mixing of higher speed air above the ground down within the boundary layer as the sun heats the ground, which drives the mixing.
Voting:
Good: 7
Bad: 0
Tags: wind

Wind Direction
27 Oct 2016 05:40 AMThe featured chart displays a time series of wind direction reports from all automated airport weather stations in the state. A low pressure system moved over the state yesterday and a high pressure system settled into the state overnight. The impact of both systems on the distribution of wind direction reports is interesting to look at! The chart shows consistent wind direction reports on Tuesday from the east and southeast. The circulation around the low pressure system on Wednesday spread all the reports to show all directions reported at the same time in the state. The high pressure overnight effectively reversed all those reports as the circulation is opposite. Kind of neat!
Voting:
Good: 10
Bad: 0
Tags: low high wind
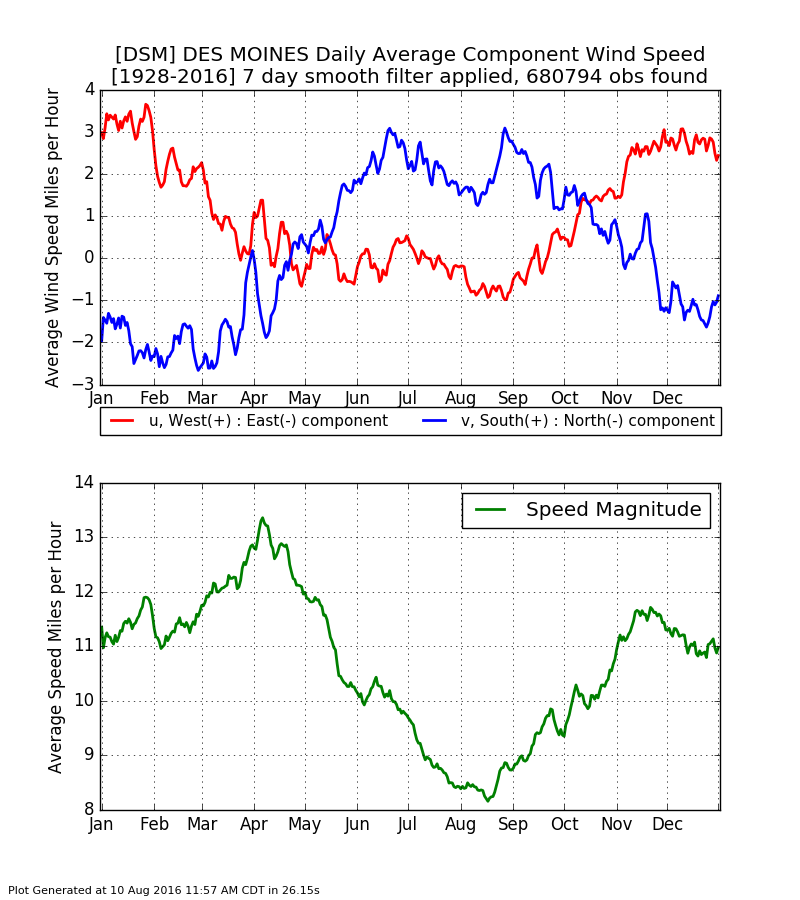
Wind Climatology
11 Aug 2016 05:42 AMThe featured chart displays daily wind speed climatology for Des Moines. Wind can be broken up into vector components. The u component is the east/west portion of the wind and the v component is the north/south portion. This component analysis is useful as the v component is primarily responsible for warm/cool air mass transport into the state. The top panel shows the daily component average wind speed and the bottom panel shows the total wind speed average. You may wonder why the magnitudes do not match well between the plots. The top panel is vector averaged, so for example a 10 mph north wind report and then a 10 mph south wind report would yield a vector average speed of 0 for both components (zero net transport). The top panel nicely shows the period each year where cool or warm air transport is the most common.
Voting:
Good: 7
Bad: 1
Tags: wind
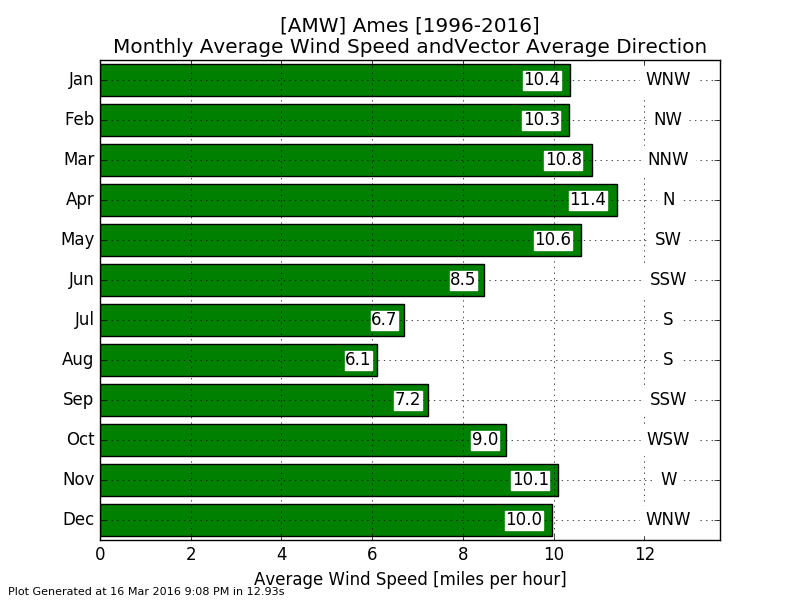
Monthly Winds
17 Mar 2016 05:37 AMA strong storm system to our east helped bring very strong winds to the state on Wednesday. Having windy days in March should be expected as it is one of our windiest months as shown by the featured chart of monthly average wind speed and direction for Ames. Only April is shown to have slightly stronger winds than March. Springtime often features strong contrasts in temperature which drive windy conditions. Winds will be brisk today, but a bit lighter than Wednesday!
Voting:
Good: 8
Bad: 0
Tags: wind

Wind Direction and Dew Point
19 Jun 2015 05:38 AMEarlier this week, the average dew point at a given temperature was featured. Today's feature show the combination of average dew point for a given wind direction. On Thursday, dew points were comfortable with a northerly wind. The featured chart shows a clear relationship between the wind direction and the average dew point for June at Des Moines. Of course, our major source of humidity comes from the south, so it would make sense that our dew points are higher with a southerly wind.
Voting:
Good: 30
Bad: 14
Abstain: 25
Tags: wind dewpoint
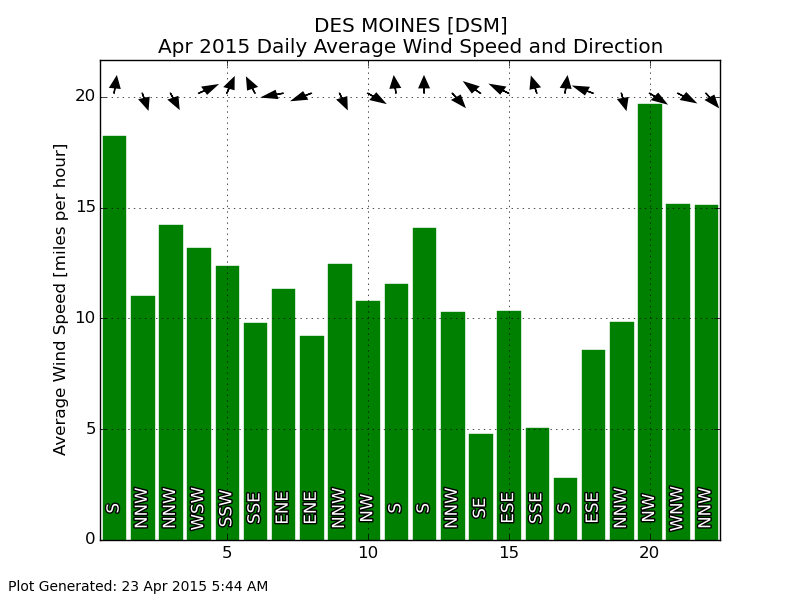
April Wind
23 Apr 2015 05:48 AMThe past three days have been plenty windy as strong northwest flow has persisted. The featured chart presents the daily average wind speed and direction for Des Moines Airport this month. Winds during the daytime are much stronger than at night as the sun promotes lower atmosphere mixing during the day, which brings higher speed air down to the ground where we live! The climatology for April is around 10-11 MPH, so this year is not much windier than average.
Voting:
Good: 10
Bad: 5
Abstain: 5
Tags: apr wind
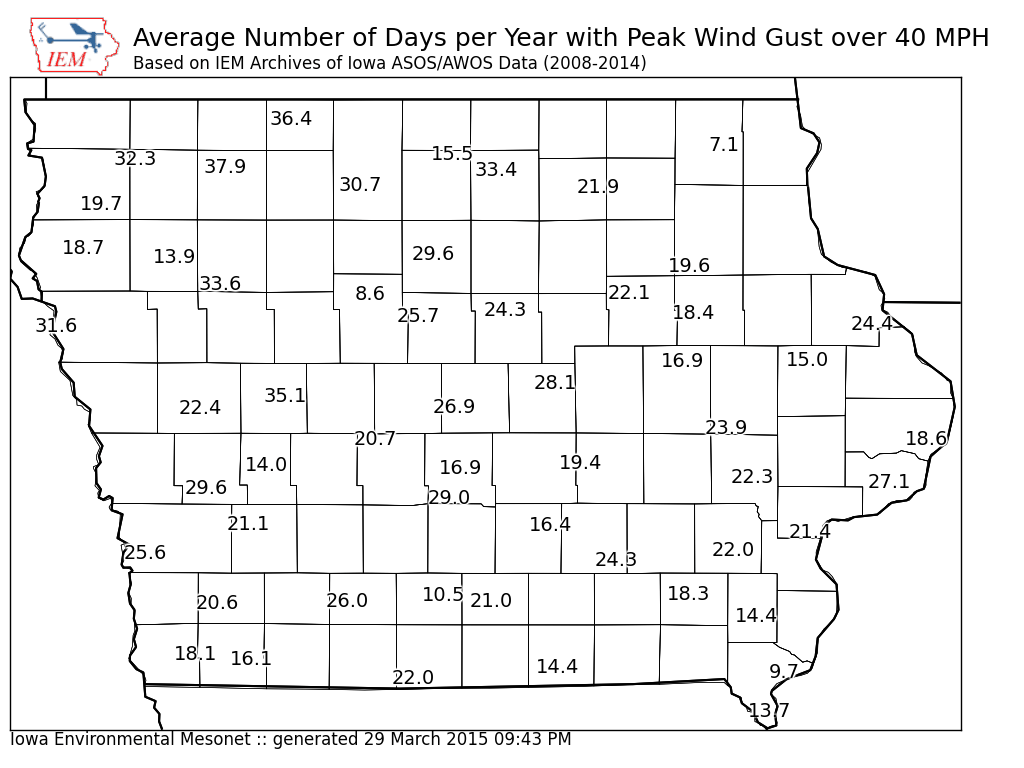
Days with 40 MPH winds
30 Mar 2015 05:40 AMSunday was a very windy day over Iowa with gusts over 40 miles per hour for much of the state. The featured map presents the average number of days per year that the peak wind gust for the day was over 40 mph. Local terrain and siting can make a big difference for this metric as obstructions will slow down the wind. Today will be another windy day with much warmer temperatures than what we saw this past weekend.
Voting:
Good: 18
Bad: 12
Abstain: 8
Tags: wind
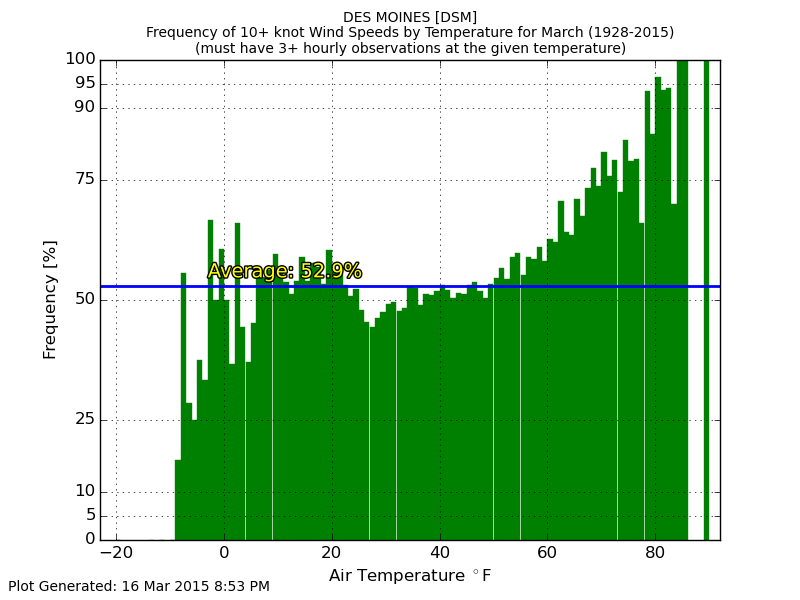
Windy When Warm
17 Mar 2015 05:43 AMTemperatures soared on Monday with highs exceeding 80 degrees for much of the state. Sioux City was able to reach 90! Strong winds were also present with the very warm temperatures, which as shown by the featured chart is very common when temperatures get this warm in March. The chart shows the frequency of having a 10+ knot wind speed present at a given temperature in March. As temperatures increase, the chance that strong winds are present increases as well. Restating, strong winds are necessary to help produce very warm conditions in March. On the cold end of temperatures, the opposite is true. Brisk winds at night time help to keep the lower atmosphere mixed and near surface air temperatures are not able to cool to very cold levels.
Voting:
Good: 19
Bad: 8
Abstain: 2
Tags: wind temps

Pressure Gradient Winds
16 Jan 2014 05:55 AMAfter a windy Tuesday, winds are on the increase today and expected to gust upwards of 50 mph. These strong winds are forced by horizontal differences in pressure as air moves from areas of higher pressure to areas of lower pressure. The featured chart presents the combination of an approximate pressure difference over the state to the observed wind speed for Des Moines. An informal forecasting rule of thumb is that for every 4 millibars difference in pressure over Iowa leads to a wind of 10 more miles per hour. For example, a 12 millibar difference should support a 30 mph wind speed. The chart would indicate that this is a fair approximation with most of the distribution near the theoretical line.
Voting:
Good: 41
Bad: 7
Abstain: 7
Tags: forecasting wind pressure

Sustained Winds
04 Nov 2013 05:37 AMSunday was a very wind day over Iowa thanks to a deepening storm system to our west. For Des Moines, the peak sustained winds over a three hour period was 23 mph during the afternoon hours. The featured chart presents the IEM computed daily maximum three hour sustained wind speed for Des Moines. Note, this value is based on hourly reports and not a direct measure of sustained winds over the hour. The chart shows the annual cycle with peaks in spring and fall along with the minimum during summer. While thunderstorms can bring momentary bursts of 70+ mph winds, the sustained winds are powered by strong and large storm systems feeding off the sharp contrasts in air masses. These types of systems are not found around here in the summer time as the cold air masses are relegated well north. The two days shown over 50 mph were 3 April 1946 and 5 May 1950.
Voting:
Good: 42
Bad: 4
Abstain: 3
Tags: wind
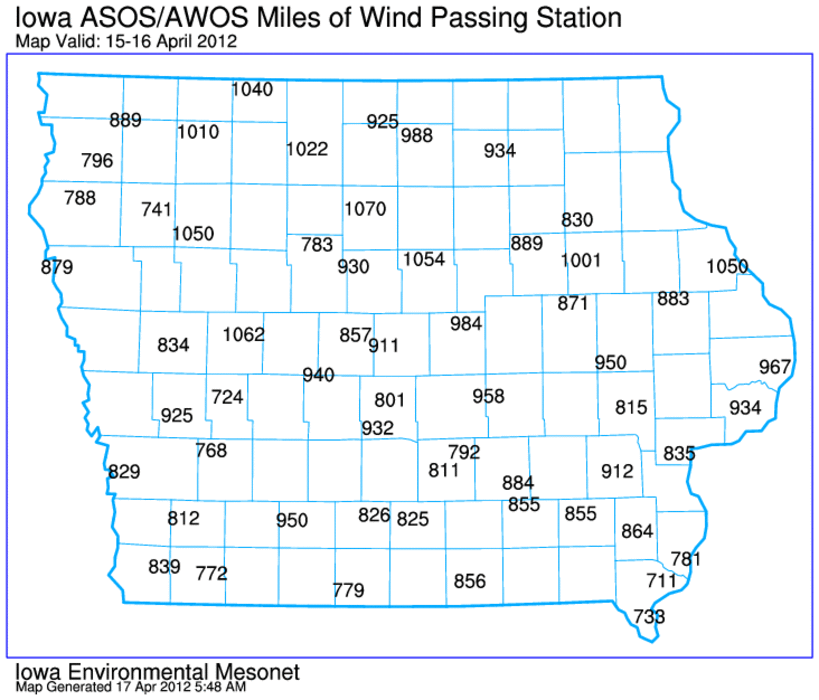
Thousand miles of wind
17 Apr 2012 05:56 AMThe past two days have seen quite a bit of wind with high wind warnings and wind advisories issued by the National Weather Service. The featured map presents a crude calculation of the amount of air that passed by an observation station as expressed in miles of wind. As in your car, the distance traveled is simply the product of your speed and the time you traveled at that speed. This calculation is shown in the featured map with some locations over 1,000 miles in the past two days. More gusty winds are expected today.
Voting:
Good: 34
Bad: 6
Tags: wind

Windy Days
28 Nov 2011 05:49 AMSince setting record high temperatures on Thanksgiving, our weather has been on the windy side with wind gusts measured above 30 mph each day since somewhere in the state. The featured chart presents the climatology of having one or more hours of wind observations at or above 30 mph for each day of the year. The annual signal is clear with these events more limited in the summer and peaking during the transition seasons of spring and fall. There are some localized peaks due to peaks in thunderstorms and strong winter storms.
Voting:
Good: 14
Bad: 2
Tags: wind

Wind components
09 Sep 2010 06:01 AMThe wind speed and direction can be broken into two components. These are a south to north (v wind) and west to east (u wind) component. [Those of you that failed geometry may wish to vote bad now]. The featured graph presents the daily averaged u and v wind speed component. This chart shows a clear annual cycle. Outside of the summer months, the jet stream is often nearby and tends to help promote dominant westerly winds. The v winds show us the dominant air temperature advection regimes with northerly (negative v values) during the winter time and warm southerly (positive v) in the summer time. September is shown as a transition period with westerlies increasing and southerlies decreasing.
Voting:
Good: 43
Bad: 6
Tags: wind climate

As windy as it has been all summer
31 Aug 2010 06:00 AMSustained wind speeds on Monday were some of the strongest we have seen since early May as shown by the featured image. The black line represents climatology and nicely shows the yearly minimum in winds during the early part of August. Wind speeds will increase as surface temperature gradients become stronger during the spring and fall seasons. Thunderstorms are back visiting the state this morning with more expected into Thursday.
Voting:
Good: 22
Bad: 7
Tags: 2010 wind

Wind reliability
07 Jan 2009 06:18 AMContinuing in the series of climate features, today's plot is of the hourly frequency of an observed 10+ mph wind speed by month based on archived data from Des Moines. Those of us that live in Central and Northwest Iowa notice the many wind farms that are being built. Obviously, these turbines need reliable wind speeds to generate power. This plot indicates that outside of the afternoon hours in the spring and fall, having 10+ mph winds is roughly a 50% or lower chance on a daily basis.
Voting:
Good: 17
Bad: 5
Tags: climate wind

Hourly wind climatology
03 Dec 2008 06:17 AMThe featured plot continues the series of hourly climatology plots. This plot is of average hourly wind speeds by hour and by month. The windiest time of year appears to be 4 PM in April and the least in the early morning in August. This plot nicely shows two maximums in the spring and fall. These are a result of the season transition periods as warm and cold air fights over Iowa! Large temperature gradients result in stronger winds.
Voting:
Good: 18
Bad: 14
Tags: climate wind