Past IEM Features tagged: sounding

Extreme Dryness
13 Dec 2023 05:30 AMThose of you that monitor RADAR every day probably noticed the reflectivity returns work into southwestern Iowa late Tuesday afternoon and evening. These returns were not producing much at the ground level as extremely dry air was present between the falling water aloft and ground. The Omaha sounding launched Tuesday evening captured an astounding -46.7 Celsius dew point temperature at 925 hPa. For those of you hoping for English units, the dew point was -52 Fahrenheit at about 1500 feet above the ground. The featured chart presents how the Tuesday evening sounding for dew point temperature compared with the period of record archive for the site at the various mandatory observation levels. For the 925 hPa level, this was just shy of the coldest/driest value observed on record. A manual computation found this profile to be the second driest behind that -50.5C value on 29 Feb 2010 at 0 UTC. Such extremely dry air masses typically originate from stratosphere and are brought to the near surface via energetic storm systems.
Voting:
Good: 14
Bad: 0
Tags: sounding dry

Meager Shear
05 Jun 2023 05:30 AMThe weather to start off June has more resembled August with slow moving afternoon thunderstorms driven by a humid air mass and strong heating. The slow storm movement has even been in uncommon directions to the west and southwest. The reason is that the flow of air aloft is rather stagnant from the east and without much directional nor speed shear to support more robust thunderstorm activity. The featured chart presents a measure of speed sheer between the surface and 3km aloft based on an archive of soundings from Davenport. The units and concept here maybe a bit too meteorological, but generally higher shear values support more robust thunderstorms by allowing the updraft and downdraft of the storms to be separated. Otherwise you get pulsey behavior as the downdraft interferes with the updraft. Anyway, you can see how recent sounding values this year have been at the very low end of a climatological range.
Voting:
Good: 13
Bad: 0
Tags: sounding shear

May Precipitable Water + Rain
25 May 2023 05:20 AMThe NWS office near Omaha launches a weather balloon at 7 AM and 7 PM each day to sample the troposphere for weather variables like temperature, humidity, pressure, and wind speed. This vertical profile can be evaluated for the amount of water vapor present and is expressed as a liquid water depth called precipitable water. Rewording, if you condensed all the water vapor in a column of air, what depth of water would that equate to. This metric is very useful for a number of weather forecasting needs as it can ballpark potential rainfall rates. The featured chart compares the 7 PM sounding for May precipitable water against the following twelve hours of accumulated precipitation for Omaha. The dots represent the combination of those two and the line is an estimate of the percentage of days with precipitation. The chart nicely shows the usefulness of this metric for precipitation forecasting. It is very difficult for a dry (low precipitable water) atmosphere to produce precipitation and higher precipitable water amounts allow for larger precipitation totals. The red dots show the 2023 values.
Voting:
Good: 11
Bad: 0
Tags: precipitablewater sounding

500hPa Heights Falls + Thunder Reports
05 May 2023 05:30 AMWith hopefully a return to thunderstorms in store over the coming days, the featured chart takes a bit of a deep dive into some meteorology regarding thunderstorm forecasting. A vital set of observations to understand the state of the atmosphere are the twice daily soundings taken by the NWS. These soundings report observations at mandatory pressure levels as the balloons ascend to help produce consistent spatial analyses over the globe. Perhaps the most important pressure level for meteorologists is 500 hPa, which is approximately a half way point (from a mass perspective) and often can provide insights into atmospheric stability and steering currents to forecast storms. The vertical height above sea level and how it is changing with time can yield first pass assumptions on if the air in the column is rising or sinking. For storms, rising air is desired. So the featured chart compares the 12 hour change in 500 hPa height and if thunder was observed over this same 12 hour period based on sounding and METAR/airport data from Omaha, NE. The data is partitioned by month and if thunder was or wasn't observed. The data is presented as split violin plots, so to give a sense of the distribution of the values. An important note is that the two sides are not equally scaled. The labels near the bottom indicate the percentage of thunder cases that coincided with decreasing heights. Whew! So what insight does this chart provide? First, it is clear that decreasing heights are dominant for thunder cases during the cold season. They are less coincident during the summer season, how could that be? The scale of the storm systems involved is the explanation as cold season thunder activity is associated with large storm systems that will be easily sampled by the twice daily soundings. During the summer time, thunderstorm complexes are smaller scale and driven by more subtle features in the atmosphere, which are not easily diagnosed by twice daily soundings.
Voting:
Good: 15
Bad: 0
Abstain: 1
Tags: meteorology sounding thunder
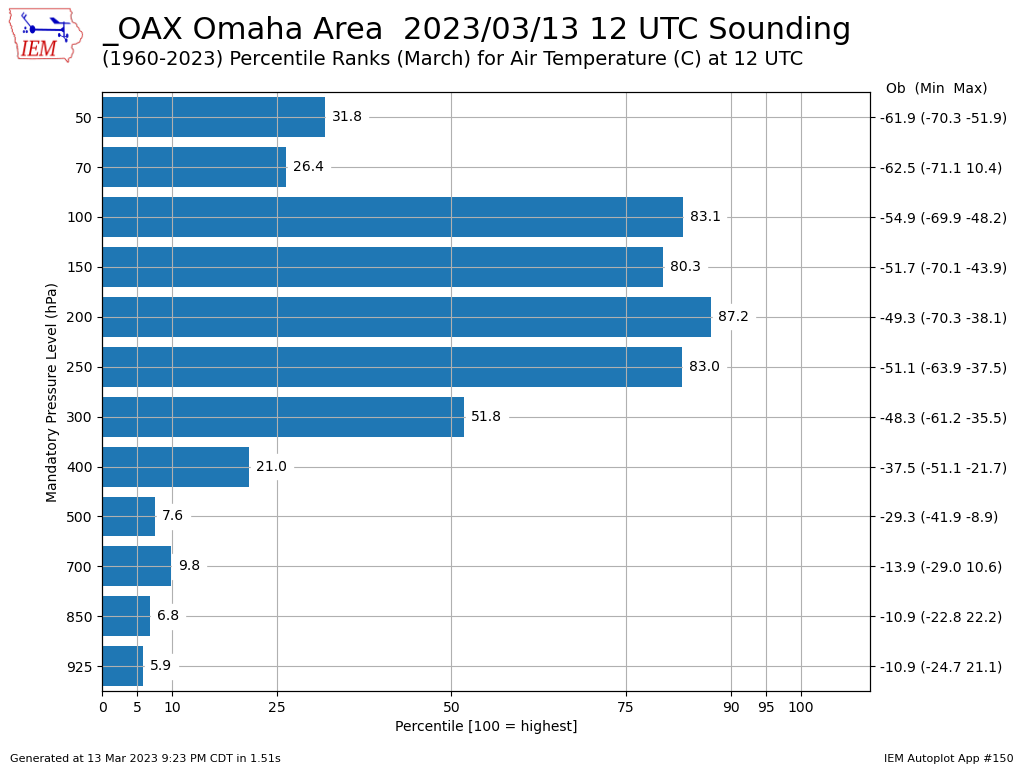
Cold Profile
14 Mar 2023 05:30 AMMonday was a very raw and not at all spring break like March day for Iowa. Much of the state stayed below 32 degrees Fahrenheit for the entire day! When it is cold at the surface, it is often interesting to look aloft to see how cold it is there as well. The featured chart presents mandatory level sounding temperature percentiles for the Omaha sounding from Monday morning. Indeed, the temperature percentiles aloft are cold as well for March, but you may wonder why things reverse as you reach 400 hPa and higher levels. The reason is when the lower atmosphere is colder than average, the thickness as measured by distance between pressure levels decreases and pressure levels higher up occur at lower altitudes. Temperatures are warmer at lower altitudes and so the temperatures reported at a given pressure level are higher.
Voting:
Good: 7
Bad: 0
Tags: sounding

Freezing Rain Soundings
03 Jan 2023 05:30 AMYesterday's featured map showed that the Ice Storm Warning is a rather rare headline issued by the National Weather Service. The main reason why it is rare is that a number of factors need to align and the margin between an event turning to all snow or to all rain is very thin. The featured chart presents a quick analysis of Omaha soundings coincident with reports of freezing rain from the airport weather station. There are caveats galore with a plot like this, but some general characteristics are informative. While the Omaha airport was reporting rain at the time, the profile for Monday evening (3 January in UTC) is included as well for a comparison. The left panel shows the air temperature profiles and right panel shows the height of the maximum temperature. In general, the plot shows the classic warm "nose" aloft that allows falling precipitation to melt to rain and then fall into a shallow layer of air near the surface that is just below freezing. The red line shows the profile last night and it can be seen to be too warm to support freezing the precipitation.
Voting:
Good: 11
Bad: 0
Tags: sounding freezingrain

Calm Winds Aloft
15 Sep 2020 01:51 PMEach day, locations like the Omaha and Davenport NWS Offices release helium filled balloons with instrumentation attached that generate vertical profiles of our troposphere and into the stratosphere. These balloons are released twice per day at 6 AM and 6 PM CST (7 AM / 7 PM CDT). The featured chart presents the morning (12z) 500 hPa wind speeds reported for the Omaha site this year along with a climatology based on available archive for the site. The 500 hPa level is an important level for understanding how storm systems will move and develop. This morning's wind speed was only 1 meter per second and about as calm as you will find at this level in the atmosphere for any time of year.
Voting:
Good: 14
Bad: 0
Tags: sounding

Weak Flow
30 Jun 2020 05:26 AMThe featured chart presents yearly averaged wind speed at 500 hPa during June for Omaha based on long term soundings at the site. This level in the atmosphere is important for understanding how storms will move and their morphology. In general, stronger wind speeds are supportive for more damaging storms (read: wind, hail, tornadoes) and weaker winds favor localized heavy rainfall producers. The relationship isn't that simple, but the generality holds this year with a decreased amount of severe weather and localized heavy rainfall events.
Voting:
Good: 10
Bad: 0
Tags: sounding

Calm Aloft
02 Jul 2019 09:34 PMWith all the heat and humidity around recently and given that thunderstorms feed on such reservoirs, one may wonder why the storms on Tuesday weren't very severe. Besides the lack of any defined surface front to help focus thunderstorm development, another limiting factor was weak winds aloft. The featured chart depicts July sounding level percentiles of wind speed for Omaha based on the morning sounding on Tuesday. Winds aloft were generally very light and even below the 5th percentile at 250 and 200 mb. Severe Thunderstorms generally need stronger winds aloft to help segregate an updraft and downdraft within the storm. With weak winds, storms tend to pulse with the downdraft disrupting the updraft.
Voting:
Good: 18
Bad: 1
Tags: sounding

Temperatures Above Us
18 Dec 2018 05:34 AMTemperatures warmed nicely on Monday with highs in the 40s for those without significant snow cover. Do warm surface temperatures translate to warm temperatures aloft? The featured chart presents December temperature percentiles for mandatory sounding pressure levels from the Omaha site on Monday night. Values of 100 would indicate the warmest on record for the site. Please recall that pressure decreases with height, so the first value shown at 925 mb is the closest to the surface. So indeed the levels nearest to the ground are warm as well, which makes sense as this is the air that mixes to the ground during the day. But as you go up higher in the atmosphere, temperature percentiles go down until rapidly increasing again above the tropopause. The explanation is a bit complex, but likely involves the 400 to 50 mb levels being anonymously high due to the warmer lower atmosphere and thus colder temperatures near the tropopause.
Voting:
Good: 8
Bad: 1
Tags: sounding

High 500hPa Heights
18 Jul 2018 05:35 AMThe featured chart depicts May, June, and July yearly averaged 500 hPa level heights from the Omaha area sounding site. This year's value, so far, is the highest on record and an indicator of the warm conditions that have prevailed during this period. Soundings are the twice daily released balloons that profile the temperature, pressure, humidity and wind condition of the atmosphere. The high height of the 500 hPa surface is an indication of warmth of the air between the ground surface and that height.
Voting:
Good: 7
Bad: 0
Tags: sounding

Clouds headed west
16 May 2018 05:34 AMThe observant weather watcher on Tuesday may have noticed the fair weather cumulus clouds headed west during the afternoon hours over central Iowa. This is somewhat rare as our winds aloft are generally blowing easterly. An easy way to assess the frequency of this happening is to look at wind roses for available upper air sounding sites. The featured image presents such a wind rose for Omaha at the 850 hPa level. This level is approximately where the clouds were on Tuesday. The 7 PM sounding from the site reported an east-northeast wind at that level and the wind rose would indicate this is the least frequent wind direction during May based on period of record data.
Voting:
Good: 8
Bad: 0
Tags: windrose sounding

Cold Air Above Us
24 May 2017 05:33 AMTuesday was a return to chilly weather that has plagued our recent stretch of weather. Even with these chilly temperatures, convective clouds were able to form and bring brief shots of rain to the state and even a few reports of funnel clouds. The reason is that the air above us was relatively cool as well, so any bit of heating that the sunshine was able to produce resulted in rising parcels quickly reaching their lifted condensation levels and forming clouds. This rapid vertical motion with low cloud bases also promotes funnel clouds. Anyway, the featured plot shows mandatory sounding level temperature percentiles for the sounding Tuesday evening from Omaha. The lower atmosphere profile is dominated by cold percentiles around 10% and less. Interestingly, this reverses at levels above the tropopause.
Voting:
Good: 6
Bad: 1
Abstain: 1
Tags: sounding

High Heights
20 Jun 2016 05:35 AMThe big story in weather over much of the country are the extreme high temperatures being reported with 120 degrees being reported in some isolated locations over the desert southwestern US. This heat extends vertically in the atmosphere as well with a very strong ridge in place supporting this heat wave. Twice a day, vertical soundings of the atmosphere are sampled by weather balloons launched from a number of locations around the world. The featured chart looks at the reported height above sea level that a given mandatory pressure level was reported to be at on Sunday morning and the percentile rank of that value against the period of record for the Omaha area. Many of these levels are at record high heights for June as indicated by the percentiles near 100.
Voting:
Good: 9
Bad: 1
Abstain: 1
Tags: sounding

Cold above us as well
19 Feb 2015 05:41 AMEven with plenty of sunshine on Wednesday, temperatures struggled well below freezing. There is currently plenty of cold air at the surface and above our heads as shown by the featured chart of 850 hPa temperatures for the Omaha sounding site. We've had two periods of near record warmth at this level followed by our current period at near record cold. This level is just a few thousand feet above our heads and represents air that is potentially mixed down during the say as the sun mixes the lower atmosphere.
Voting:
Good: 18
Bad: 7
Abstain: 4
Tags: sounding

500 hPa Temperatures
10 Jun 2014 05:38 AMThe featured chart presents a climatology of 500 hPa (millibar) temperatures from the morning sounding for Omaha along with this year's observations. This pressure level in the atmosphere is some over 3 miles above the ground surface and is one of the important levels meteorologists look at to forecast the weather. The chart clearly shows the significant dip around mid May that accompanied the very cold temperatures. Recently temperatures have been on the decrease, which helps promote thunderstorm activity as colder temperatures aloft create unstable situations.
Voting:
Good: 14
Bad: 2
Abstain: 4
Tags: sounding

Cold above us too
25 Mar 2014 05:37 AMNear surface air temperatures have been a struggle recently and the same goes for the air just a few thousand feet above our head. The featured chart displays a weekly climatology of 850 hPa morning sounding temperatures from the Omaha site. The black line is a time series for this year and the dip below the 5th percentile this past weekend coincides with the cold temperatures we have experienced. With such cold air above us, any heating the sun is able to do of the surface will likely drive clouds and as we experienced yesterday, convective snow showers. Having warmer air above our heads allows near surface air to warm to higher temperatures.
Voting:
Good: 16
Bad: 3
Abstain: 2
Tags: sounding
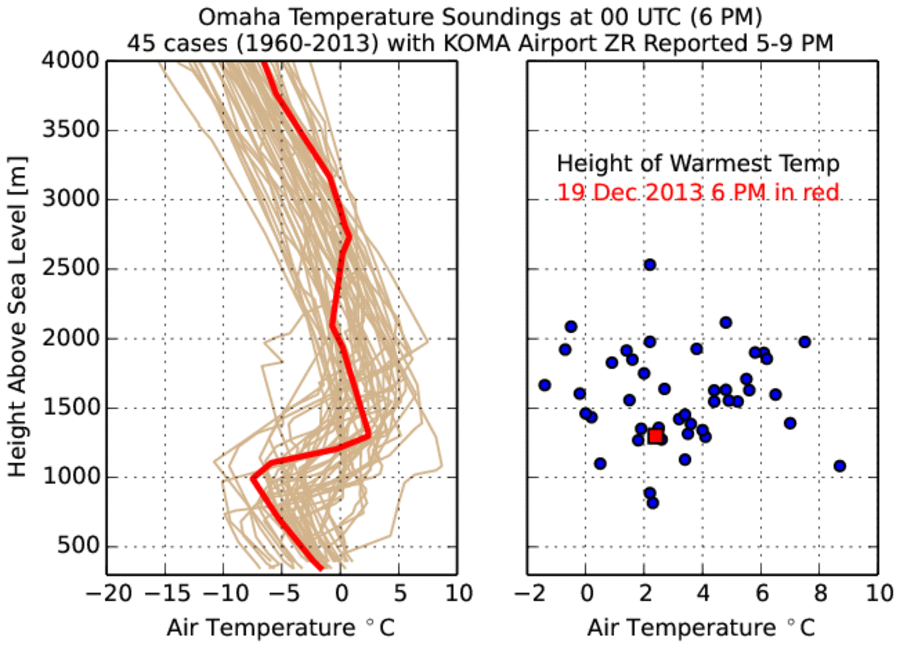
Freezing Rain Profiles
20 Dec 2013 05:39 AMMuch of Iowa experienced freezing rain on Thursday evening and into Friday morning. Freezing rain happens when liquid water, in the form of rain, is able to reach the surface and then freeze as the physical surface and air temperature are both below freezing. In this situation, the layer of below freezing air temperature needs to be shallow otherwise the rain drops will freeze and hit the ground as sleet. The featured chart looks lower atmosphere soundings from the Omaha site during events of freezing rain reported at the Omaha Airport. The cases shown depict the classic freezing rain signature of having a shallow layer of freezing temperature air near the surface with another layer of above freezing temperature air above it. The left hand plot presents the profile of temperature for the 45 cases used in this analysis, including the event from Thursday evening. The right hand plot depicts the level of the warmest temperature for each of those cases. The warm layer of air is centered just a few thousand feet above the ground at temperatures typically above freezing. What would be snow falls into this warm layer, melts and reaches the ground as liquid water. Note: since the case selection was based off of automated data, some of the profiles shown may not have been producing freezing rain.
Voting:
Good: 83
Bad: 16
Abstain: 12
Tags: freezingrain sounding

540 Thickness
22 Oct 2013 12:01 AMA forecasting rule of thumb is to look at something called the "540 thickness" to delineate snow versus rain events. The technique involves subtracting the height of the 1000 mb surface from the 500 mb surface. When this depth of air, or thickness, falls below 540 decameters (5400 meters), the air is typically cold enough to support snow. The featured chart presents the combination of this thickness value vs near surface air temperature for events where rain or snow were reported by the Omaha airport weather station. There are many caveats to this chart including exact timing issues and changes in automated reporting techniques for rain + snow. The application of this chart to today's weather is that thicknesses are well below 540 over eastern Iowa and closer to 540 over western Iowa. Snow is more likely the further east into the falling precipitation you go!
Voting:
Good: 50
Bad: 5
Tags: forecasting sounding snow

Severe 500mb Flow
19 Sep 2013 05:43 AMSevere weather looks to be a possibility today with the passage of a cold front. The featured chart presents the combination of 500 hPa flow as observed by the Omaha sounding on September days with severe thunderstorm and/or tornado warnings issued for Iowa. The polar chart shows the wind direction and speed with the size of the dots indicating the number of warnings issued that day. 500 hPa (same unit as millibar) flow is important to thunderstorms as changing wind speed and/or direction is necessary with increasing height to separate updrafts and downdrafts in long lived thunderstorms. During the summertime, wind shear is often weak and so a downdraft will often choke out the updraft of a storm and limit its lifetime. The chart shows that at least 10-20 knots of wind speed are typically needed for severe events. The forecasted wind at 500 hPa this evening for Omaha appears to be around 30-40 knots from the WSW.
Voting:
Good: 74
Bad: 11
Tags: sounding

Lapse Rates
14 Aug 2013 05:26 AMAtmospheric soundings provide twice daily vertical profiles of the troposphere and lower stratosphere. The lapse rate is calculated from this profile as the rate of temperature change with height. The featured chart presents the monthly distribution of the lapse rate between 850 and 500 hPa (millibar) pressure levels for the Omaha sounding site. This is roughly from a typical cloud base to midway vertically through the cloud. When this lapse rate is below 6 °C per kilometer, the atmosphere is in a stable condition meaning vertical temperature gradients are not large enough to drive robust motions due to buoyancy. When values are between about 6 and 9.5, the atmosphere is conditionally unstable and vertical motions are likely to occur. Values above about 9.5 are said to be absolutely unstable and vertical mixing will happen quickly. The chart shows the strongest instabilities during the summer season, which is also the time of year for thunderstorms. Of course, there is a direct relationship between thunderstorms and lapse rates. Stability increases (lower lapse rate) in the winter time and so we see fewer thunderstorms. For comparison, recent lapse rates have been in the mid 5s, which is not high enough for robust storms.
Voting:
Good: 57
Bad: 4
Tags: sounding lapserate

13C Forecasting Rule
06 Aug 2013 05:35 AMWhen the sun heats the ground, the ground heats the lower atmosphere which drives a mixing process with warm air rising and cold air sinking. This mixing process grows vertically creating a well mixed layer. If this mixing encounters colder air aloft, relatively more heating needs to occur to continue raising the temperature of the mixed layer. If this mixing encounters warmer air aloft, the heating process can accelerate as temperatures are already warm. Atmospheric soundings sample the atmosphere twice per day. The morning sounding provides a sampling of the air above our heads that may be mixed down during the day. A informal rule of forecasting in the plains is to add 13 Celsius to the 850 hPa (millibar) level temperature to provide an afternoon high temperature. For example, the morning sounding on Monday for Omaha had 16.2°C at 850 hPa and when you add 13°C to that reading it yields a high temperature of 85°F. The actual high was 87°F! The featured chart looks at the monthly distribution of change in afternoon high temperatures from the 850 hPa morning temperature. The green bar represents 13°C. The box plots provide detail on the temperature distributions and for the warm six months of the year, this relationship closely approximates the monthly mean. The cold months are dominated by horizontal advection processes and also have decreased solar heating, so this rule does not apply well then.
Voting:
Good: 99
Bad: 7
Tags: sounding forecasting

Cold above our heads
29 Jul 2013 05:43 AMThe past few days have been rather remarkable for July with record lows being set over parts of the midwest. Each day the sun heats the ground, which warms the air near to the ground. This warmed air vertically mixes growing what is known as the planetary boundary layer. The air temperature we experience near the ground is a result of the strength of the surface heating and the mixed air down from above. The featured chart shows a climatology of air temperatures at the 850 hPa pressure level for the sounding site near Minneapolis for its 12 UTC (6/7 AM CT). This level is typically included in the planetary boundary layer. For this recent event, the temperature at this level (2.2 centigrade) was the coldest on record for the site in July.
Voting:
Good: 108
Bad: 16
Tags: sounding
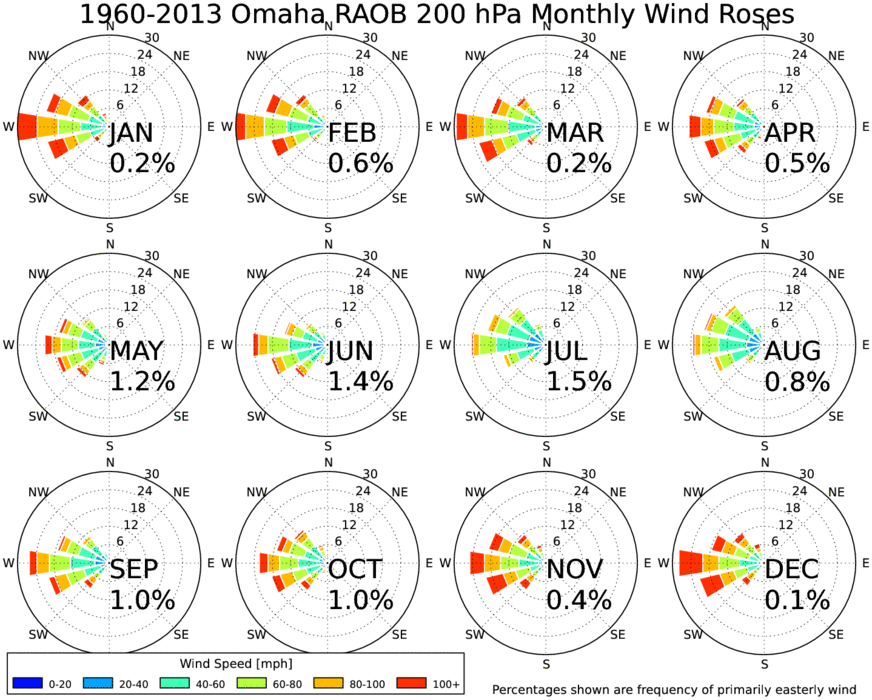
Easterly winds aloft
17 Jul 2013 05:17 AMThe weather pattern earlier this week was a bit strange with the southern plains experiencing a storm system that traveled west! The winds well above the ground surface, that help guide storm systems, were actually from the east. The featured chart looks at the frequency of easterly winds at a height of 200 hPa (millibars), which is about 7- 8 miles above the earth surface. The chart presents 12 wind roses, one for each month for the sounding site near Omaha. The site launches a weather balloon twice per day, providing a vertical profile of temperature, humidity, pressure, and winds. The wind roses provide frequencies of wind direction and speed. Westerlies clearly dominate for all months of the year. Each month is labelled with the percentage of observations that are primarily easterly. The highest percentages (although meager) are in the summer time, which is when the jet stream (very strong westerlies) is furthest away permitting such flow to occur. So while such events are very rare, this is the time of year when they most frequently happen.
Voting:
Good: 84
Bad: 16
Tags: sounding

Thin Clouds
10 May 2012 05:56 AMIf you live in Iowa, you may have noticed that the clouds yesterday afternoon were very thin (having short vertical extent). The featured chart presents a vertical sounding of the atmosphere over Ames based on model data from the RAP model. The red line is temperature and green line is dew point. As the sun heats the ground, the lower part of the atmosphere warms and mixes vertically until it reaches air that is relatively much warmer and unwilling to mix down. The sounding shows that this level was very well defined with a sharp increase in temperature and rapid decrease in moisture. This caused the vertical extent of the clouds that developed at the top of the mixed lower atmosphere to be very flat.
Voting:
Good: 30
Bad: 7
Tags: sounding

Lots of water
07 Jul 2010 06:07 AMThe featured chart is from the excellent precipitable water climatology page on the Rapid City, SD NWS website. The chart displays the observed monthly ranges of the amount of water in the atmosphere. On Monday evening, the Davenport sounding had well over 2 inches of water observed, which is near the maximum end of the range. All of this water in the atmosphere makes for efficient rainers as slow moving storms are able to quickly process all of that water in the column.
Voting:
Good: 20
Bad: 8
Tags: sounding