Past Features
This page lists out the IEM Daily Features for a month at a time. Features have been posted on most days since February 2002. List all feature titles.
Mon Jan 02, 2023

Ice Storm Warning
02 Jan 2023 05:34 AM
2023 is getting off to an active start with the National Weather Service issuing an Ice Storm Warning for much of northwestern Iowa. The featured map presents the most recent year that a given county in Iowa was under such a warning. The IEM's database only goes back to 2008, but the Ice Storm Warning is one of the rarest headlines issued in Iowa by the NWS. This map indicates that four counties have not seen such a headline over this period.
Voting: Good - 11 Bad - 0
Tags: icestorm
Generate This Chart on Website
Tue Jan 03, 2023

Freezing Rain Soundings
03 Jan 2023 05:30 AM
Yesterday's featured map showed that the Ice Storm Warning is a rather rare headline issued by the National Weather Service. The main reason why it is rare is that a number of factors need to align and the margin between an event turning to all snow or to all rain is very thin. The featured chart presents a quick analysis of Omaha soundings coincident with reports of freezing rain from the airport weather station. There are caveats galore with a plot like this, but some general characteristics are informative. While the Omaha airport was reporting rain at the time, the profile for Monday evening (3 January in UTC) is included as well for a comparison. The left panel shows the air temperature profiles and right panel shows the height of the maximum temperature. In general, the plot shows the classic warm "nose" aloft that allows falling precipitation to melt to rain and then fall into a shallow layer of air near the surface that is just below freezing. The red line shows the profile last night and it can be seen to be too warm to support freezing the precipitation.
Voting: Good - 11 Bad - 0
Tags: sounding freezingrain
Wed Jan 04, 2023
'22-'23 Winter Storm #11
04 Jan 2023 08:21 AM
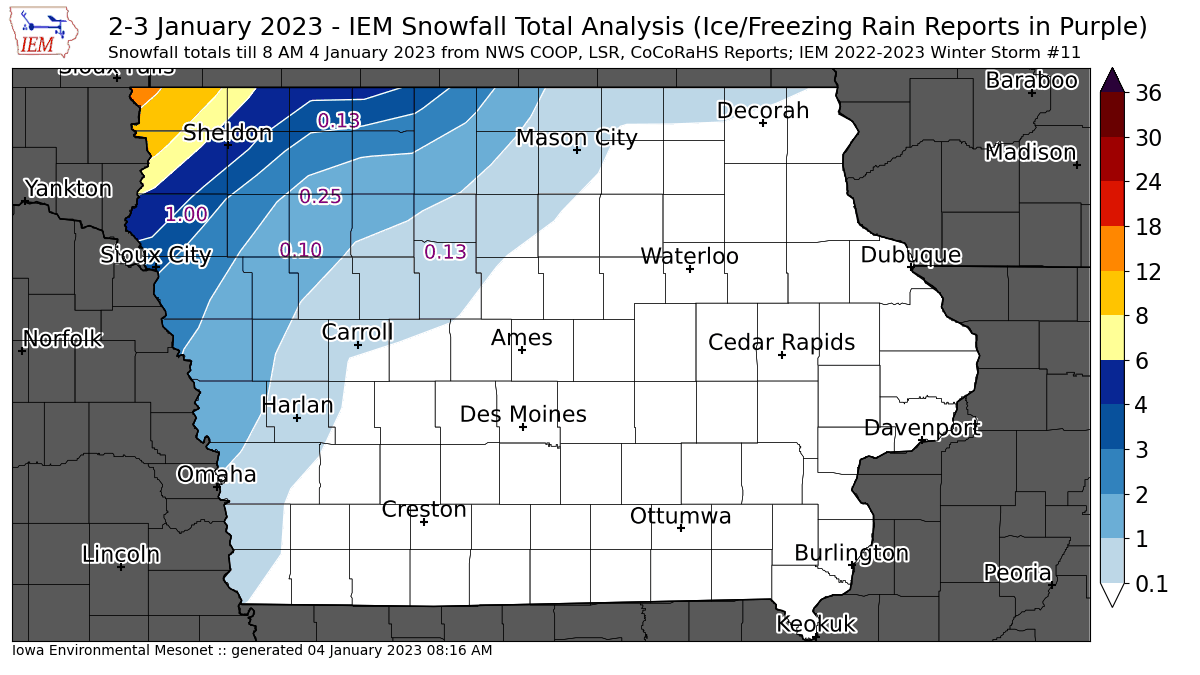
While the heaviest snowfall totals with the current winter storm only clipped far northwestern Iowa, much of the rest of the state picked up much needed rainfall. The featured map presents an analysis of available NWS and CoCoRaHS snowfall reports. The plotted numbers represent ice accumulation depth reports. While northwestern Iowa received the worst of this storm, many other parts of the state received enough freezing rain and sleet to make for poor travel conditions on Tuesday that have persisted into Wednesday. A minor dusting of snow and some freezing drizzle will cause more grief today over Iowa.
Voting: Good - 10 Bad - 0
Tags: winter2223
04 Jan 2023 08:21 AM
While the heaviest snowfall totals with the current winter storm only clipped far northwestern Iowa, much of the rest of the state picked up much needed rainfall. The featured map presents an analysis of available NWS and CoCoRaHS snowfall reports. The plotted numbers represent ice accumulation depth reports. While northwestern Iowa received the worst of this storm, many other parts of the state received enough freezing rain and sleet to make for poor travel conditions on Tuesday that have persisted into Wednesday. A minor dusting of snow and some freezing drizzle will cause more grief today over Iowa.
Voting: Good - 10 Bad - 0
Tags: winter2223
Thu Jan 05, 2023

Drought Busting?
05 Jan 2023 05:30 AM
Our recent weather has been quite wet with both rain and snow bringing much needed moisture to the state. An ongoing question is how much impact this wet weather has had on the drought situation for Iowa. The featured chart presents the combination of trailing 91, 182, and 365 day precipitation departures for Ames along with the coincident US Drought Monitor classification. This week has seen an inch plus of rainfall for Ames, which is exceptional for the winter season and produced a noticeable impact to the 91 day departures, but the 181 day departure remains about unchanged. This is the problem with drought busting during the winter season as rainfall amounts are generally not enough to erase departures that accumulated during what should have been the wettest time of year. While a daily inch of rain during January is exceptional, it just erases a single dry week or two during August. There is also the issue of where all this rainfall went with frozen soils likely leading to most of it running off, but the drought monitor also considers reservoir levels and streamflows, which have certainly been helped by the recent wet weather.
Voting: Good - 8 Bad - 0
Generate This Chart on Website
Fri Jan 06, 2023

'22-'23 Winter Storm #12
06 Jan 2023 06:02 AM
While more a continuation of the previous storm, another wave of energy and moisture was able to produce a few inches of snowfall over Iowa on Wednesday into Thursday. A few reports around two inches were made near Spencer and approaching two inches near Cedar Rapids. There's a lot of variability within this smoothed data presentation as the snow showers were isolated and somewhat transient. The near term forecast has mostly dry weather, so hopefully we can take a break from the snow for a little while.
Voting: Good - 13 Bad - 2
Tags: winter2223
Mon Jan 09, 2023

Fog and Clear Skies?
09 Jan 2023 05:30 AM
The featured chart presents a time series of horizontal visibility and cloud coverage reports from the Mason City airport. The top panel tries to mimic the sky coverage amount and level reports by coloring areas in blue that are reported to have clear skies and areas in darker colors that are overcast. The skinny panel shows the horizontal visibility reports. The combination of the two are very interesting over this past weekend with reduced horizontal visibility being reported at the same time as clear skies! How can that be? Well, the automated reports are coming from different sensor packages that are looking in different parts of the lower atmosphere. The clear skies report is coming from a sensor that is attempting to look above any low level fog that may be happening and indeed we are generally cloud free above the fog, so that is why these two values can be so different. We have recently been plagued by a very shallow layer of cold air trapped near the surface by a strong inversion aloft. This has prevented much warming of air temperatures during the daytime and the persistent fog with the moisture that is trapped in this layer as well.
Voting: Good - 10 Bad - 0
Generate This Chart on Website
Tue Jan 10, 2023

Special Weather Statement Counts
10 Jan 2023 05:30 AM
The National Weather Service (NWS) issues a wide variety of text products with the goal of saving life and protecting property. Each product has a slightly different aim and is used in different situations. The Special Weather Statement (SPS) is a catch-all product to alert folks to weather that may be slightly below warning/advisory limits and/or used to cover about everything else under the sun. The IEM has a massive archive of NWS text products dating back to the mid 1980s. The NWS has changed a lot of procedures and policies over the years, but the text product format remains. So the featured chart presents the total number of SPS products issued by month and year for NWS Des Moines. Since the product usage has changed and the SPS itself has changed over the years, such a plot should be considered with a grain of salt. Of immediate interest is the heavier usage of this product during the early 1990s and general absence of usage during the mid 2000s. You can generate this product for other product types / offices via the "Generate this Chart on Website" link below.
Voting: Good - 10 Bad - 0
Tags: nws
Generate This Chart on Website
Wed Jan 11, 2023

Burlington Min High
11 Jan 2023 05:30 AM
Since the bitter cold and blizzard around Christmas time, much of Iowa has enjoyed rather nice temperatures. Burlingon, in far SE Iowa, has had a minimum daily high temperature of 28 degrees since the 28th of December. The featured chart presents the yearly minimum high temperatures over the period from then through 10 January. The 2022-2023 value doesn't make the top 10 warmest and is even comparable with two of the recent three years. It is interesting to note some of the years in the top 10 coldest as many of those were epic winters, since 1911-1912, 1981-1982 and 1978-1979. Given our ongoing La Nina, it is unlikely for this winter to experience such sustained cold as well.
Voting: Good - 10 Bad - 0
Generate This Chart on Website
Thu Jan 12, 2023

Exceeding Annual Climatology
12 Jan 2023 05:30 AM
Thanks to a significant and ongoing "atmospheric river" event, Bishop, California has already received more precipitation this year (5.00") than their annual climatology (4.84"). Based on NWS COOP sites with at least 50 years of data, the featured map presents the minimum year to date period that a given site was able to reach its present day annual precipitation total by. For example, sites in gray would have had at least one year with a year to date total by the end of January exceeding the yearly average. There is a nice and informative pattern to be seen over the contiguous US. Values in Iowa are in the July through August range, which means that the earliest a given site has received at least ~30 some inches of rain was by 1 July. Of course, having such an early date is only possible for sites that are already quite arid and can experience such significant events during the cold season.
Voting: Good - 13 Bad - 0
Tags: precip
Fri Jan 13, 2023

Days to Exceed Climatology
13 Jan 2023 05:30 AM
Yesterday's daily feature was a map presenting the minimum number of year to date days a given long term climate site took to reach its yearly climatology. This was in response to a location in California already exceeding its average yearly total. Since the start date of 1 January is a bit arbitrary, today's featured map presents the minimum number of days over any period to accumulate a year's worth of precipitation. This change normalizes the map somewhat and again, some interesting patterns can be seen. Iowa is shown in the 90 to 180 day range, which for an approximate yearly average of 30 some inches, would equate to three or more months in a row averaging ten inches per month. This maps has some neat regional patterns and again California sticks out for having sites in the one to seven day range!
Voting: Good - 14 Bad - 0
Tags: precip
Mon Jan 16, 2023

January SPC Outlook
16 Jan 2023 07:03 AM
For a number of recent days, some weather forecast models were showing a rather robust environment to support severe convective storms in Iowa today. Thankfully, the threat appears to have backed off considerably now and the Storm Prediction Center has just a general thunder "TSTM" risk for much of the state today. The featured info graphic displays the number of days since a given SPC Day 1 Convective Outlook threat category for Iowa during the month of January. Of course, it is very rare to have severe thunderstorms in Iowa during January as everything is usually too cold and surface moisture is limited by cold temperatures. The weather forecast focus turns to a significant snow storm arriving Wednesday!
Voting: Good - 12 Bad - 0
Tags: spc
Generate This Chart on Website
Tue Jan 17, 2023

Tornado Warnings in January
17 Jan 2023 05:30 AM
First it was the serial derecho of 15 December 2021, then it was the Winterset EF-4 tornado on 5 March 2022, and yesterday Iowa experienced a EF-1 tornado near Williamsburg on 16 January 2023! Each of these cold season convective events are remarkable and somewhat concerning to have happen during a time of year whose weather should be relegated to cold and snow! Having a tornado during January in Iowa is not without precedent as it happened once (at least since 1950) before on 24 January 1967 with 13 tornadoes that day. The featured chart presents the monthly number of tornado warnings for Iowa since 1986 (the start of the IEM curated archive). The four yesterday are the only shown for January, but the caveat is that pre ~1992 data is not of the best quality and the NWS was issuing tornado warnings prior to 1986... Anyway, still a very remarkable event and another cold season convective event for the weather history books!
Voting: Good - 11 Bad - 0
Tags: tornado
Generate This Chart on Website
Wed Jan 18, 2023

Near Annual Minimum
18 Jan 2023 05:30 AM
With severe convective storms just on Monday, it is a bit odd to consider that we are at or very close to the date of minimum daily average temperature for the year. The featured chart presents the daily climatology for January for Ames with the most recent two iterations of the NCEI 30-year climatology and a simple daily average computed by the IEM over the period of record. Even with over 100 years of data, the simple daily average is rather noisy and a primary reason why the NCEI climatology is smoothed to give a more meaningful daily average value. You may wonder why the NCEI values are almost always higher than the period of record values. The NCEI data represents a recent period of years that is overall warmer than years prior, so their average value will be higher than something that considers cooler years in the past.
Voting: Good - 14 Bad - 0
Generate This Chart on Website
Thu Jan 19, 2023
'22-'23 Winter Storm #13
19 Jan 2023 10:09 PM
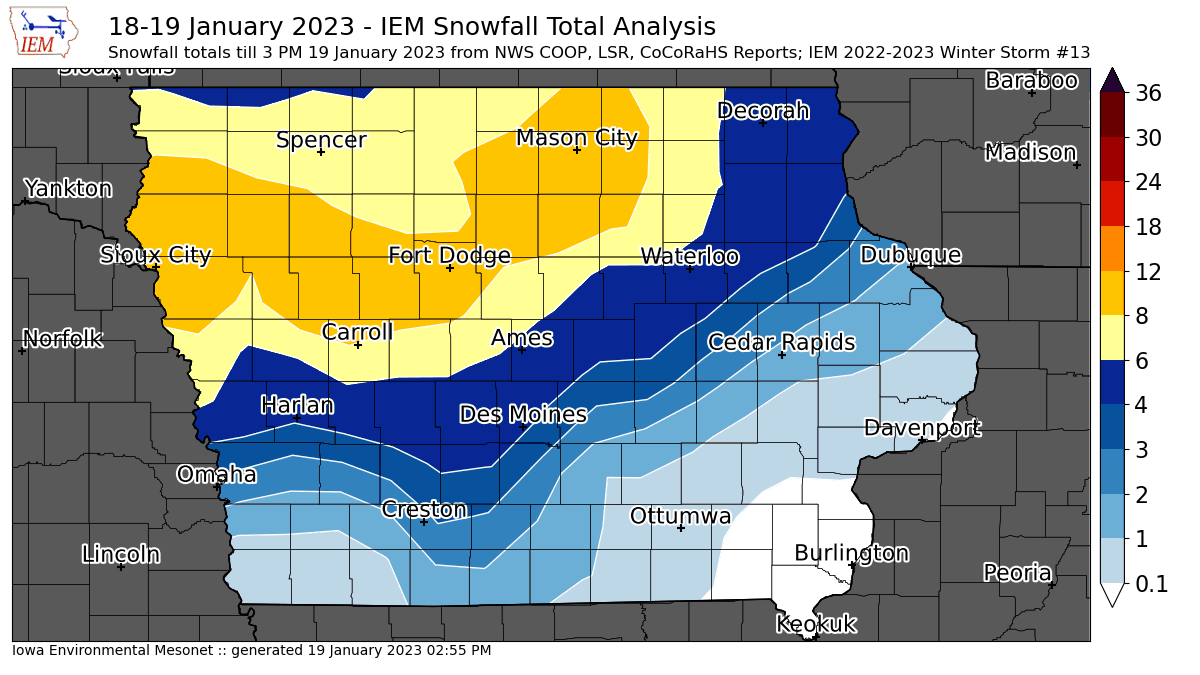
Some snow continues to fall this Thursday morning, so the featured map of available snowfall reports will be updated later today and tomorrow as more reports are received. This snowfall was extremely wet and with snow to liquid ratios well below ten. The heaviest totals are to be found over western Iowa with a few reports of around ten inches. This snowfall created significant travel impacts on Wednesday night as its heavy nature and rapid falling meant snow plows were unable to keep up. Having temperatures near freezing today will help the removal process and hopefully allow applied materials to do work. The issue comes tonight as temperatures will cool and the very wet snow will likely cause refreeze / ice to cause troubles.
Voting: Good - 16 Bad - 2
Tags: winter2223
19 Jan 2023 10:09 PM
Some snow continues to fall this Thursday morning, so the featured map of available snowfall reports will be updated later today and tomorrow as more reports are received. This snowfall was extremely wet and with snow to liquid ratios well below ten. The heaviest totals are to be found over western Iowa with a few reports of around ten inches. This snowfall created significant travel impacts on Wednesday night as its heavy nature and rapid falling meant snow plows were unable to keep up. Having temperatures near freezing today will help the removal process and hopefully allow applied materials to do work. The issue comes tonight as temperatures will cool and the very wet snow will likely cause refreeze / ice to cause troubles.
Voting: Good - 16 Bad - 2
Tags: winter2223
Fri Jan 20, 2023

Warm Start to 2023
20 Jan 2023 05:30 AM
The flow pattern over the contiguous US so far this January has kept the really cold air away from Iowa. The featured chart presents the daily high and low temperature departures from period of record averages for Ames. The top panel presents the averages and 2023 observations with the bottom panel showing the departures. Little time has been spent below average so far and the near term forecast does not contain much for bitter cold temperatures.
Voting: Good - 12 Bad - 0
Generate This Chart on Website
Sun Jan 22, 2023
'22-'23 Winter Storm #14
22 Jan 2023 10:53 AM
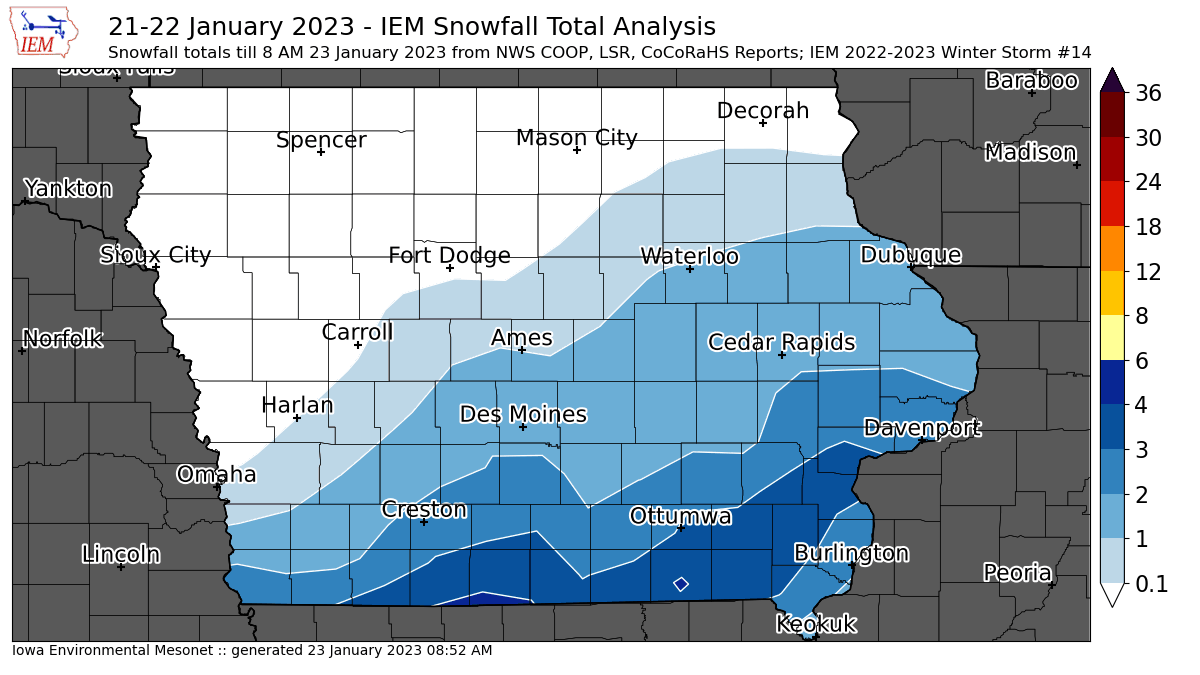
Southern Iowa had been mostly below average for season to date snowfall, but the most recent winter storm made up some of the difference with the highest totals near four inches to be found along the Missouri border. The featured map presents available snowfall reports from the NWS and CoCoRaHS. Unlike the storm previous which brought liquid rich snowfall, this event was a bit fluffier with snow to liquid ratios closer to the classic 10 to 1 value and even higher. Winter looks to remain firmly entrenched this week with a few chances of snow and temperatures sticking below or near freezing.
Voting: Good - 13 Bad - 3
Tags: winter2223
22 Jan 2023 10:53 AM
Southern Iowa had been mostly below average for season to date snowfall, but the most recent winter storm made up some of the difference with the highest totals near four inches to be found along the Missouri border. The featured map presents available snowfall reports from the NWS and CoCoRaHS. Unlike the storm previous which brought liquid rich snowfall, this event was a bit fluffier with snow to liquid ratios closer to the classic 10 to 1 value and even higher. Winter looks to remain firmly entrenched this week with a few chances of snow and temperatures sticking below or near freezing.
Voting: Good - 13 Bad - 3
Tags: winter2223
Tue Jan 24, 2023
January Fog Days
24 Jan 2023 04:49 AM
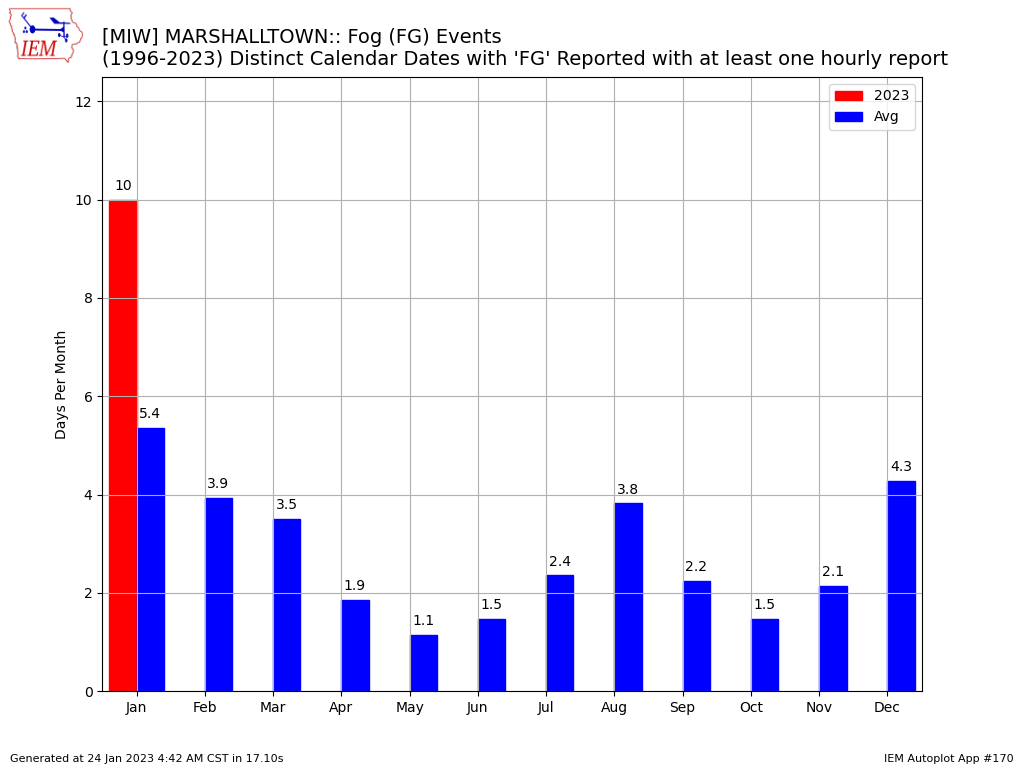
Besides death and taxes, it appears dense fog is another certainty of life. Fog is again present over Iowa this Tuesday morning. The featured chart presents the number of days each month that the automated weather station in Marshalltown reported at least one hourly report of Fog. There are caveats with automated fog reports as equipment has changed over the years, but this year's total is certainly well above a simple climatology average. For this site and analysis, it would appear January is the peak for fog days, so that is something to look forward to as we creep closer to spring!
Voting: Good - 11 Bad - 0
Tags: fog
Generate This Chart on Website
24 Jan 2023 04:49 AM
Besides death and taxes, it appears dense fog is another certainty of life. Fog is again present over Iowa this Tuesday morning. The featured chart presents the number of days each month that the automated weather station in Marshalltown reported at least one hourly report of Fog. There are caveats with automated fog reports as equipment has changed over the years, but this year's total is certainly well above a simple climatology average. For this site and analysis, it would appear January is the peak for fog days, so that is something to look forward to as we creep closer to spring!
Voting: Good - 11 Bad - 0
Tags: fog
Generate This Chart on Website
Wed Jan 25, 2023

'22-'23 Winter Storm #15
25 Jan 2023 12:54 PM
Iowa got clipped by a large winter storm system off to our south and east on Tuesday and into Wednesday. The heaviest snowfall totals were approaching four inches over far southeastern Iowa. Light snow continues to fall of some locations, so this map will be refreshed tomorrow once additional reports are received. More chances of snow are in the forecast before a well advertised shot of cold air rivaling what we received just before Christmas arrives for the weekend.
Voting: Good - 12 Bad - 1
Tags: winter2223
Fri Jan 27, 2023

Fast Start for Tornado Warnings
27 Jan 2023 05:30 AM
Severe weather, as measured by the number of Tornado Warnings issued by the National Weather Service, has gotten off to a fast start for the year. The featured chart presents an unofficial tally of such warnings for the 1 through 26 January period each year since 1986. The 2023 total comes in third highest just behind 2017 and a ways behind 1999. The majority of those 1999 warnings came during an outbreak on 21-22 January. You likely recall that Iowa has seen a few tornado warnings already with the tornado near Williamsburg last Monday! This may seem like a distant memory as we are firmly back in winter weather with plenty of cold and snow expected over the coming days.
Voting: Good - 15 Bad - 2
Generate This Chart on Website
Sun Jan 29, 2023
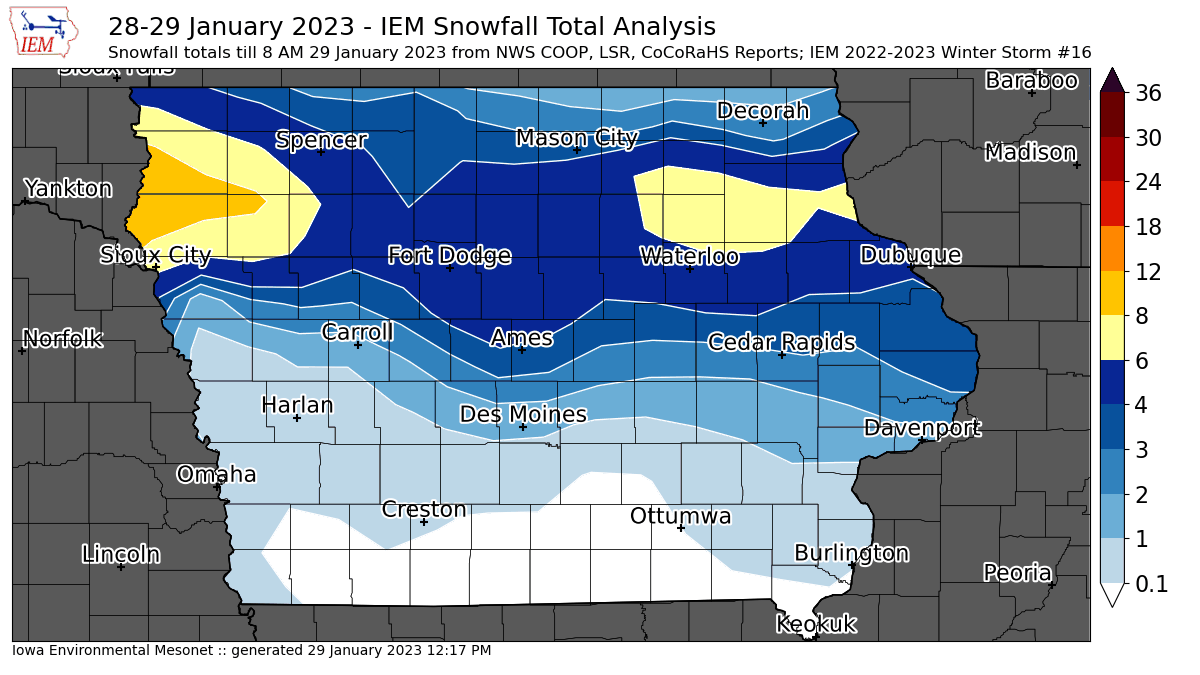
'22-'23 Winter Storm #16
29 Jan 2023 12:22 PM
A prolonged snow event lasting from early Saturday morning into Sunday morning brought a stripe of heavy snowfall over northern Iowa. The largest totals were found north of Sioux City near ten inches. Amounts trailed off to the south with a chunk of southern Iowa receiving no snowfall. Everyone is getting in on the cold weather that followed this snowfall with temperatures back to the bitter levels we had avoided since the outbreak before Christmas. The forecast this week looks to be quiet with an early week significant storm slipping off to our south.
Voting: Good - 19 Bad - 12
Tags: winter2223
Tue Jan 31, 2023

Wind Chill Advisory 1,2,3
31 Jan 2023 05:30 AM
When the National Weather Service issues alerts, they are usually sequentially numbered starting at one on 1 January. Our ongoing stretch of bitter cold wind chills has necessitated the issuance of a number of Wind Chill Advisories. The featured chart presents the combination of recent winter headlines valid for Mason City along with hourly wind chill observations. The past three days have seen three such advisories with the ongoing one scheduled to end later this morning.
Voting: Good - 12 Bad - 2
Tags: windchill
Generate This Chart on Website