Past Features
This page lists out the IEM Daily Features for a month at a time. Features have been posted on most days since February 2002. List all feature titles.
Tue Nov 01, 2022

Small October Daily Max
01 Nov 2022 05:31 AM
October was a very dry month for almost all of Iowa. The featured chart presents the maximum one day precipitation total for each October on record for Spencer. The 2022 maximum value came in at a meager 0.06" inches, which is within the top five smallest totals on record for the site. The chart also presents a trailing 30 year average and this year is even more exceptional compared with a good number of recent years that had above trend line values. This difference is one of the more concerning aspects to the present situation Iowa faces. Much of the dryness accumulated during recent year growing seasons were erased by very wet falls, which has yet to materialize this year. The good news is that the near term forecast has decent chances of rain arriving later this week, so hopefully we can get some drought busting done yet before winter arrives.
Voting: Good - 11 Bad - 0
Generate This Chart on Website
Wed Nov 02, 2022

Many Days Till an Inch
02 Nov 2022 05:32 AM
Using NOAA MRMS precipitation estimates, the featured map presents the number of days one has to go back in time before accumulating at least an inch of precipitation. The areas of extreme dryness since September and even earlier are readily apparent. It is remarkable to see how much of the state is at least in the brown color, which represents at least 50 days. More isolated spots in far northwestern Iowa are in the 70 plus day range! The good news is that the forecast continues to be very bullish for significant rainfall over Iowa over the coming seven days, but extreme northwestern Iowa looks to miss out on the highest totals.
Voting: Good - 11 Bad - 0
Generate This Chart on Website
Thu Nov 03, 2022

November Hours of 70+
03 Nov 2022 05:27 AM
November has gotten off to a wonderful start with 70s common over Iowa during the afternoon hours and another day of it expected today. The featured chart presents an accounting of hours at or above 70 during November for Des Moines. The 2022 total of thirteen hours is already way above a long term and simple average of five. The top panels shows that a number of years, including last year, failed to even once reach 70, so this year is a bit of a treat. Even with a significant rainfall event arriving on Friday, temperatures next week do not look all that bad. The pessimist here is certain we will "pay for this" with much worse weather sooner than later!
Voting: Good - 11 Bad - 0
Tags: nov
Generate This Chart on Website
Fri Nov 04, 2022

Max Rainfall in November
04 Nov 2022 05:31 AM
The anticipated and significant rainfall event is at hand with amounts expected to be over an inch for much of Iowa with isolated amounts approaching 3-4 inches over far eastern Iowa during today and into Saturday. For some places, like Marshalltown, this event could perhaps produce the maximum daily precipitation total for the year. The present max is 1.44 inches back on 22 April. The featured chart presents some metrics on the max one day precipitation event based on automated station data back to the mid 1990s. One other event is shown in November with a few in October as well, so an event on 4 November is not too far from what has happened in the past. Oh, and some light snow is expected to wrap into the northwestern corner of the state Friday night! That is certain something germane to November!
Updated: The Friday total for the site was 1.48 inches, so largest for the year.
Voting: Good - 18 Bad - 0
Generate This Chart on Website
Mon Nov 07, 2022

Welcome Rainfall
07 Nov 2022 05:30 AM
The big rainfall event this past weekend is now in the books and unfortunately not everyone fared equally. The featured map presents NOAA MRMS estimates from Friday through Sunday and shows much of the southeastern half of the state in the one to three inch range. Of course, it is not practical to expect that the entire state could have received two plus inches, so some winners and losers are bound to happen. The hope is that these rainfall events can become more frequent than they have been and the accumulated effect can wipe out individual storm differences. Such may be the case this week with the next significant rainfall chance more focused over northwestern Iowa and points northward.
Voting: Good - 12 Bad - 0
Generate This Chart on Website
Tue Nov 08, 2022

90 Day SPI Changes
08 Nov 2022 05:30 AM
A current question is how the rainfall event over this past weekend changed the drought situation over the state. The featured map evaluates the change in trailing 90 day SPI from 30 October till 6 November. The point labels on the map indicate locations that had drought classification changes by this 90 day SPI metric. Please note that the drought monitor is not a single SPI value, but a combination of many SPI values, impacts and other factors. So of interest is the degradation shown around the Dubuque area. How could this be as the area generally saw two to three inches of rainfall over the past seven days! Well, one needs to consider how this trailing 90 day window changes the precipitation totals. This area had a significant rainfall event on 7 August, which gets included in the 30 Oct value and not in the 6 November value. So the net effect is a decrease in 90 day precipitation and thus a decrease in SPI! The top right plot shows the change in station SPI and there's a massive red arrow that is one of these eastern Iowa stations that had a huge rainfall on 7 August get pulled out of the 90 day SPI evalulated on 6 November. Fun times in drought metrics land here.
Voting: Good - 8 Bad - 0
Generate This Chart on Website
Wed Nov 09, 2022

Nov Dew Point by Wind Direction
09 Nov 2022 05:30 AM
If you voted for warm and humid November conditions, the next two days will be a victory for you. If you voted for the opposite, the following many number of days will be your victory. So the forecast has something for both sides. To focus on the warmth and humidity for these coming two days, dew point temperatures are forecast to be near unofficial record highs for the month. The featured chart presents the climatology of dew point by wind direction during November for Des Moines. Values above 60 degrees are generally confined to directions from the SE to SW, which is a sign of the need for the transport of such humid air into the state from the south. Such will be the case with strong southerly winds ahead of the front that will change everything on Friday.
Voting: Good - 9 Bad - 0
Generate This Chart on Website
Thu Nov 10, 2022

Weather Extremes
10 Nov 2022 05:42 AM
The featured map is courtesy of the National Weather Service website and shows the active watch, warnings, and advisories valid last night. The extremes of possible weather are shown with a Blizzard Warning (orange color) over the Dakotas and a Hurricane Warning (red color) over parts of eastern Florida. With unofficial IEM archives back to 2008, this concurrent combination is somewhat rare with only two other events found back in Oct and Nov of 2020. Iowa will get in on the extreme weather act today with a chance of severe thunderstorms and a strong cold front ushering in much colder temperatures for the weekend.
Voting: Good - 12 Bad - 1
Generate This Chart on Website
Fri Nov 11, 2022

November Streaks Below 40
11 Nov 2022 05:30 AM
A strong cold front swept the state clean of the mild and humid air on Thursday and we are now left with an extended period of rather chilly mid November weather. The featured chart presents the longest streaks during November of having the air temperature below 40 degrees based on hourly data for Des Moines. Only a handful of events have seen streaks of 200+ hours (~8 days + 8 hours) with the most recent happening during 2014. Given the present forecast, we may take a run at establishing another such streak over the coming week. Such a streak would be rather remarkable given we don't have any snow cover which would help hold down temperatures.
Voting: Good - 8 Bad - 1
Generate This Chart on Website
Mon Nov 14, 2022

10 Day November Periods
14 Nov 2022 05:30 AM
The first ten days of November averaged 65 degrees for a high temperature for Des Moines. The following ten days are going to come up woefully short of that balmy value. The featured chart compares the 1-10 vs 12-21 November period each year for Des Moines for average daily high temperature. The chart presents a simple one-to-one line in blue and then divides the plot into quadrants based on the average values for reach axis. There isn't much predictive capability from one period to the next, so this year's situation isn't too far outside of historical norms.
Voting: Good - 8 Bad - 1
Generate This Chart on Website
Tue Nov 15, 2022
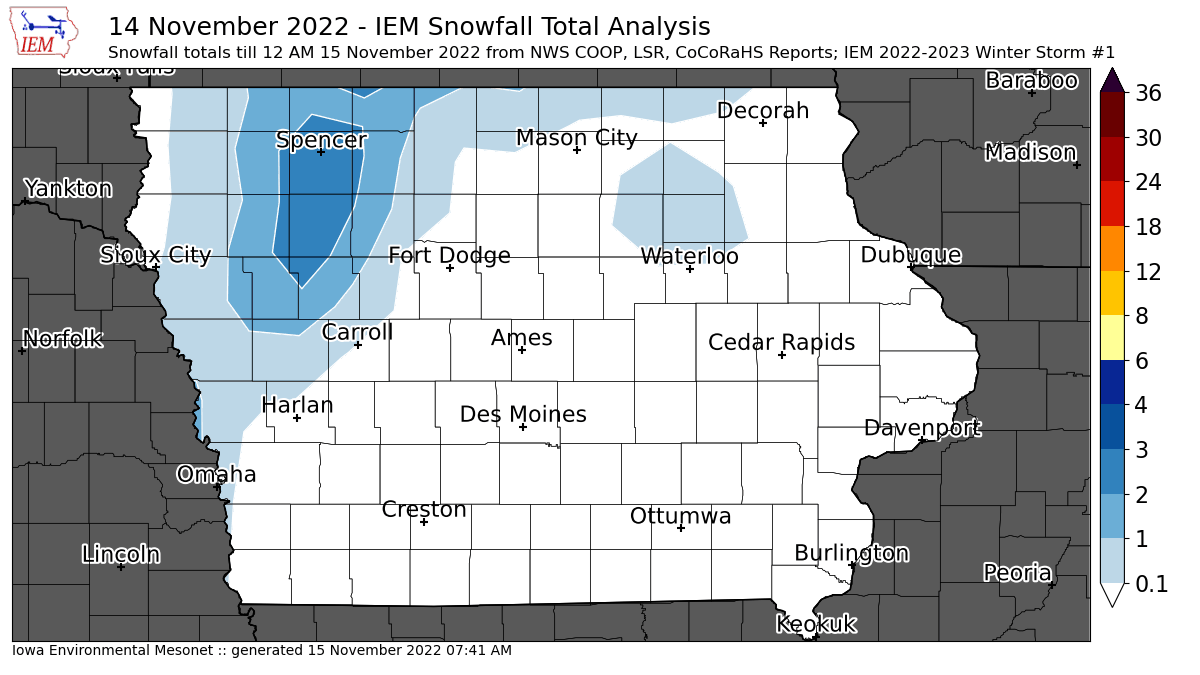
'22-'23 Winter Storm #1
15 Nov 2022 07:47 AM
Each year the IEM Daily feature attempts to document snowfall totals from individual storm events. The informal policy is for a storm to produce at least two inches of snow and/or create significant travel impacts. While some parts of Iowa have seen light snow prior to yesterday, totals were very light from those events and thus not counted here. This first significant snowfall event of the season is a tricky one as the second event is already here this Tuesday morning and thus some of the 24 hour reported snowfall totals covered parts of both storms. So some care was taken with the featured map to exclude those totals covering the second storm from this map. Caveat emptor... So the highest totals from the first wave according to available NWS COOP, Local Storm Reports and CoCoRaHS reports were confined to northwestern Iowa.
Voting: Good - 16 Bad - 0
Tags: winter2223
Generate This Chart on Website
Wed Nov 16, 2022
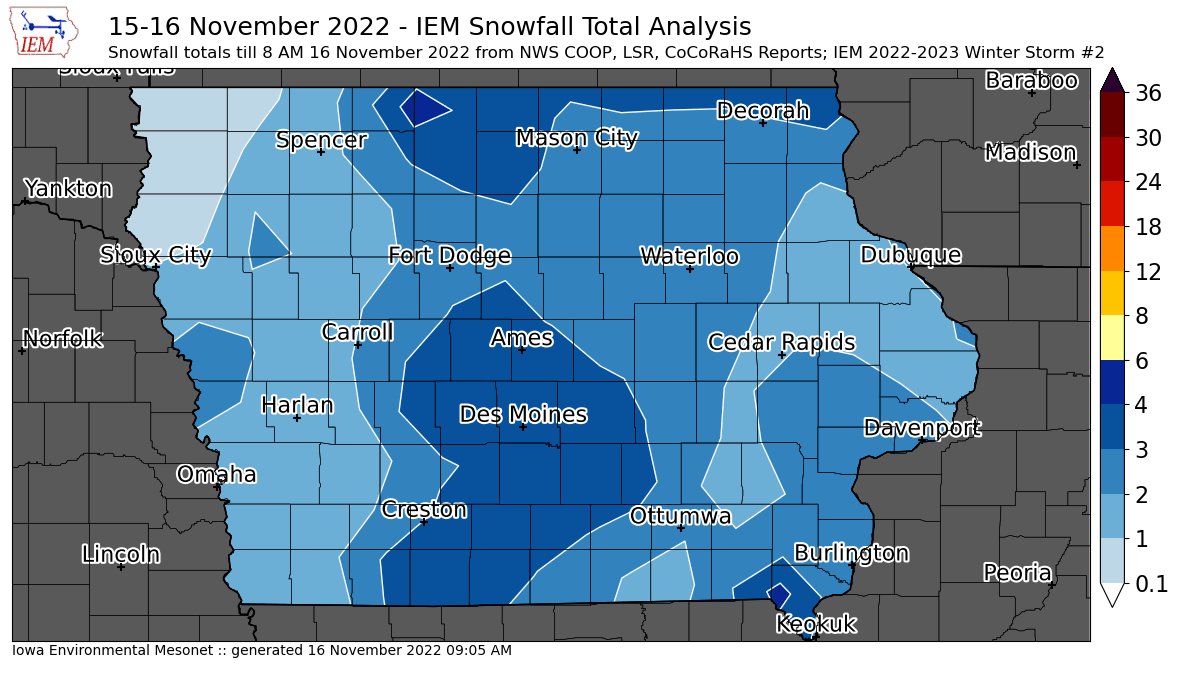
'22-'23 Winter Storm #2
16 Nov 2022 08:38 PM
The featured map is an attempt to produce an estimate of snowfall reports from the second snow storm that impacted Iowa on Tuesday and into Wednesday. There is a major caveat in that some of this snow over northwestern and northcentral Iowa was likely counted within yesterdays map, since the events overlapped the typical 24 hour reporting period. Additional snow is also still falling this Wednesday, but is expected to be very light except over portions of extreme eastern Iowa. While the snow on Tuesday was not too bad to deal with thanks to warmer temperatures close to freezing, today is a different story with temperatures well below freezing and a more difficult process to keep roads clear with some blowing snow happening as well. Regardless of all these caveats, a good chunk of the state received two to four inches of snow and a full blown taste of winter after temperatures in the 70s just last week!
Voting: Good - 12 Bad - 1
Tags: winter2223
Thu Nov 17, 2022

95% Corn Harvest Done
17 Nov 2022 05:33 AM
The weekly USDA NASS crop progress update released on Monday estimated the corn harvest in Iowa at 95% done. The featured chart presents the yearly time series of this metric expressed as a grid of daily values interpolated from the weekly reports. The white X denotes the 95% value for each of the previous years. This year is ahead of or close to the pace of each year since 2012. The outliers of 2009, 2019 (late maturity and horrible harvest conditions) and 2012 (very early maturity and drought conditions) are easily distinguishable within the chart. The good news for the folks with corn yet to harvest is that warmer weather is forecast later next week, so getting rid of the snow is generally a good thing to help finish up the harvest.
Voting: Good - 14 Bad - 0
Tags: corn
Generate This Chart on Website
Fri Nov 18, 2022

Days since last Blizzard Warning
18 Nov 2022 05:30 AM
The snow storms this week were handled by Winter Weather Advisory headlines by the National Weather Service. Their most severe headline for the winter season is the Blizzard Warning, but not every year sees such an intense situation. The featured map presents the number of days since the last Blizzard Warning per NWS Weather Forecast Office (WFO). Immediately and interestingly, you can see Hawaii at 348 days whereas most of the Iowa WFOs had 650 days and longer. The data is correct as there is some very high elevation land in Hawaii that sees intense winter storms. As an aside, the NWS recent announced that Hawaii would stop issuing Blizzard Warnings going forward as no humans live within the impacted areas.
Voting: Good - 19 Bad - 1
Tags: blizzard
Generate This Chart on Website
Mon Nov 21, 2022

Cedar Rapids Step-downs
21 Nov 2022 05:30 AM
Cedar Rapids had its coldest low temperature for the season on Friday at 16 degrees and then followed it with a record tying low of six on Saturday morning. These two events can be accounted as "step- downs" in low temperature for the season and the featured chart presents this metric. The top panel shows the number of such events per season, the middle panel shows the frequency at a given temperature for them to occur, and the bottom panel shows the frequency by day of the year. Since this metric starts on 1 July, there's an artificial blip around then until the data settles down. The total this season still is well below average and at the bottom of the long term range, so it seems very likely that further step downs will occur. It is interesting to note how the daily frequency starts to drop down by the end of December, but is still non-zero until later in March.
Voting: Good - 8 Bad - 0
Generate This Chart on Website
Tue Nov 22, 2022

La Niña Fall
22 Nov 2022 05:30 AM
The persistent La Niña continues to create weather troubles over much of the US with the ongoing drought being difficult to break. With just a few days left in the fall season of September, October, and November, it is a good time to check in on the relationship between the El Niño index and fall season average temperatures and precipitation. Since the impact of El Niño is not instantaneous, the plot compares the August value with the subsequent fall season totals for Iowa. The relationship is not necessarily direct nor strong during the fall season, but general trend is for La Niña falls to be drier and a bit warmer than average.
Voting: Good - 8 Bad - 0
Tags: elnino
Generate This Chart on Website
Wed Nov 23, 2022
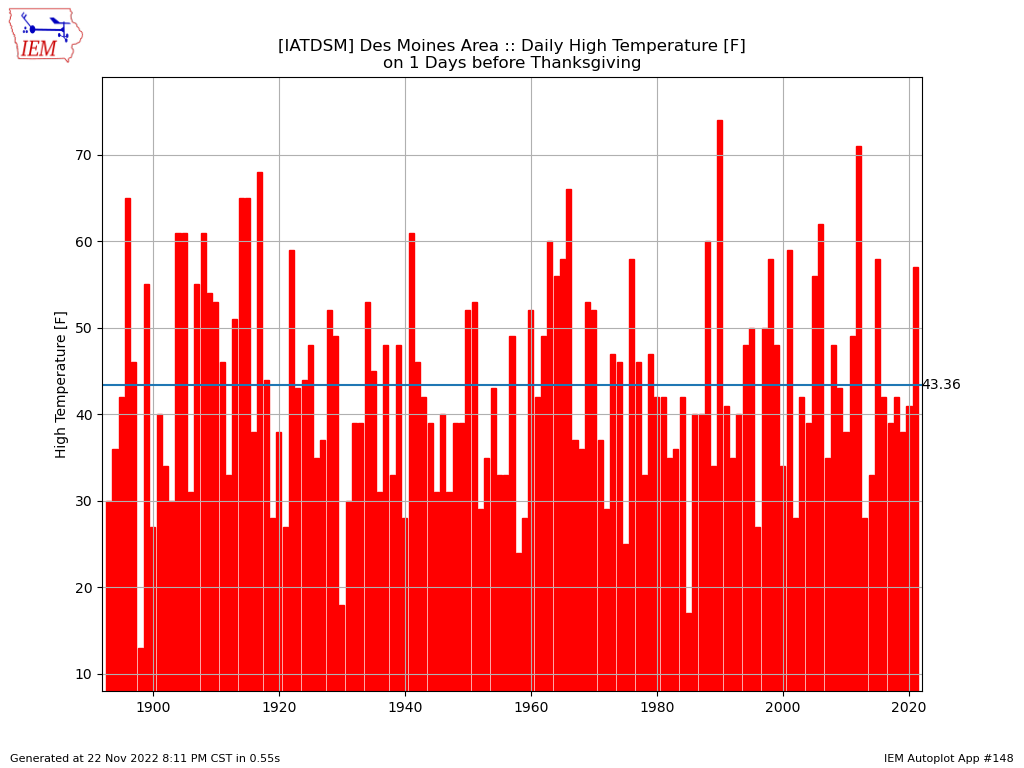
Day Before Thanksgiving
23 Nov 2022 05:30 AM
The weather forecast looks great for your travels over the river and through the woods to Grandmother's house on Wednesday. The forecast high temperature in Des Moines is expected in the low 50s. The featured chart presents the high temperature for the day before Thanksgiving each year. The simple long term average is near 43 degrees. Chances of frozen precipitation are generally more of concern than temperatures for travel this time of year and Iowa looks to steer clear of that until late into the weekend. Happy Thanksgiving!
Voting: Good - 8 Bad - 0
Generate This Chart on Website
Fri Nov 25, 2022

Ames vs Sioux City
25 Nov 2022 05:30 AM
With just over a month to go for this year and a month that does not feature all that much precipitation, it is a good time to compare totals for the year as what is done by the featured chart. The chart compares the yearly totals of precipitation for Ames and Sioux City. The difference between the two is color coded as blue when Ames is wetter for the year than Sioux City. The chart shows that only the drought year of 1988 featured a Sioux City total higher than Ames since 1962. The noise shown during the early 1900s is likely a data quality issue more than an actual difference.
Voting: Good - 7 Bad - 0
Generate This Chart on Website
Mon Nov 28, 2022

Snow Cover Temp Difference
28 Nov 2022 05:30 AM
For late November, our recent stretch of weather, including the Thanksgiving holiday, has been quite good. The absence of snow cover during this period has certain helped and allowed day time temperatures to warm nicely into the 50s. The featured chart presents daily high and low temperature distributions by month and partitioned by the presence of any snow cover. There are caveats galore to a plot like this as the snow cover report timing with the daily high and low temperature is not an exact science. That aside, the difference between the two distributions is quite clear and especially large during the early and late months of the cold season.
Voting: Good - 11 Bad - 0
Tags: snowcover
Generate This Chart on Website
Tue Nov 29, 2022

November Moderate Risks
29 Nov 2022 05:26 AM
The Storm Prediction Center has a convective moderate risk issued for today over portions of Mississippi and surrounding states. The featured map presents a heatmap of such "day 1" moderate risks during November based on unofficial IEM archives. Such events during November are rather rare with only 15 events found since 2002, but this is the second event for this November with the other happening on 4 November. The heatmap nicely shows the two areas of enhanced severe weather climatology for this time of year as they are favored battle grounds between warm/moist and cold air masses. Iowa will be miss out on the severe weather today with snow expected over northern Iowa and a quick drop in temperatures that will likely cause travel headaches.
Voting: Good - 13 Bad - 0
Tags: spc
Generate This Chart on Website
Wed Nov 30, 2022
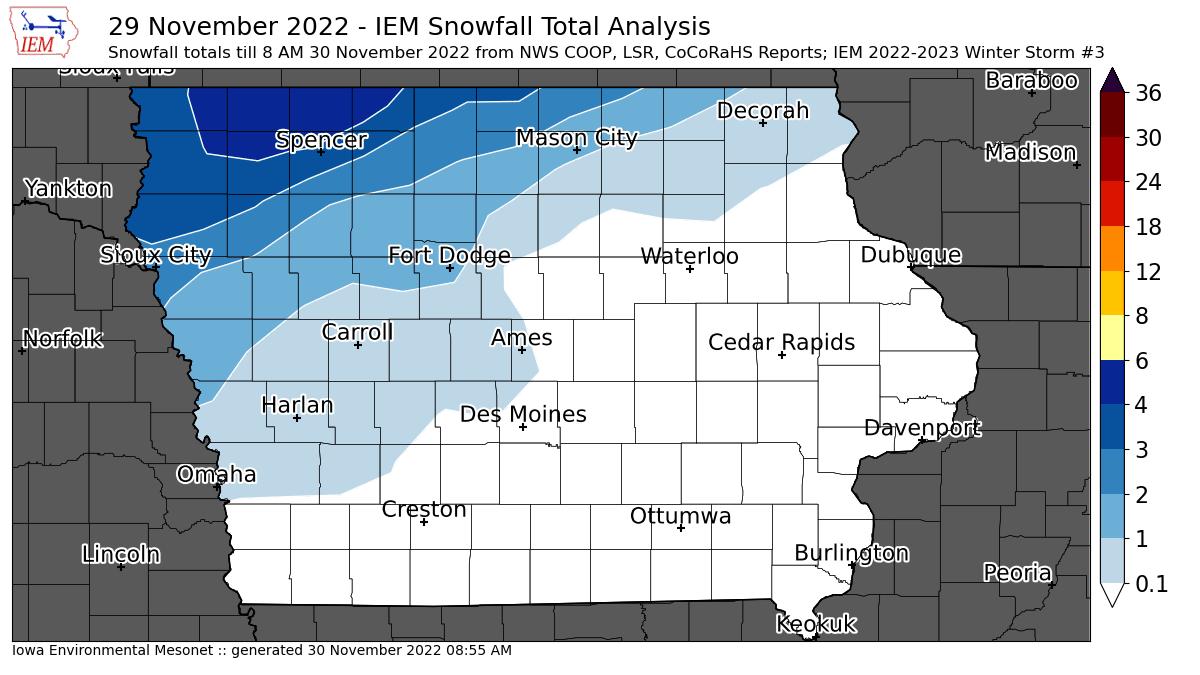
'22-'23 Winter Storm #3
30 Nov 2022 09:00 AM
Our streak of pleasant late fall / early winter weather ended abruptly on Tuesday with a snow storm producing up to six inches over far northwestern Iowa. The featured map presents an analysis of available NWS and CoCoRaHS reports. Temperatures are much colder on Wednesday and a brisk westerly wind has wind chills in the unpleasant category. The near term forecast has a wild roller coaster of temperatures with highs back in the 50s for Friday and then nose diving below freezing on Saturday.
Voting: Good - 7 Bad - 0
Tags: winter2223