Past Features
This page lists out the IEM Daily Features for a month at a time. Features have been posted on most days since February 2002. List all feature titles.
Wed Jun 01, 2022

Both Close to Average
01 Jun 2022 05:30 AM
It stands to reason that since our recently passed month featured periods of very wet, dry, cold, and hot weather, that the averages for the month would compare closely to average. The featured chart presents the combination of precipitation and growing degree day departures from average for an IEM areal averaged for Iowa. This year's value is labelled along with the most extreme years on the plot. A simple fit line is placed on the plot and shows the intuitive decrease in precipitation with increasing positive temperature anomaly. The present guidance for June has slightly above average precipitation and below average temperatures. The near term forecast and more definitive forecast is along those same lines with not much for extreme heat.
Voting: Good - 6 Bad - 0
Generate This Chart on Website
Thu Jun 02, 2022

Sioux City Trailing 90 Days
02 Jun 2022 05:30 AM
The weekly update to the US Drought Monitor is due out later this morning and will likely continue to show northwestern Iowa as the worst off portion of the state. While rains have fallen over the area over the past few months, they have not been enough to erase longer term deficits. The featured chart presents a heat map of daily trailing 90 day precipitation percent of average values for Sioux City since 2002. The value shown at a given day represents the trailing 90 day period. So the bottom row shows the 2022 daily values and you can see the transition from darker reds in February and March to showing closer to average, but still below these past two months. Of course, if you trend water long enough, you can make it to shore (long term deficits are erased by attrition). More significant rains would certainly be welcome to ensure enough water for the growing season, but the charts only show major positive departures during the summer months for one year (2014) over this period.
Voting: Good - 11 Bad - 0
Generate This Chart on Website
Fri Jun 03, 2022

Centered on Iowa
03 Jun 2022 05:32 AM
June has started off with very pleasant temperatures and low humidity levels, making for what many want for nice spring season weather. Will this weather continue? One forecast to consult is the NOAA 6-10 day outlook as shown by the featured map. It presents the probability of above or below average temperatures and not necessarily the magnitude of such differences. The analysis has a bullseye over Iowa with the largest below average probabilities. The actual quantitative forecast for this period does continue the daily time highs in the 70s and pleasant overnight temperatures as well.
Voting: Good - 15 Bad - 0
Mon Jun 06, 2022

Sunday Downpours
06 Jun 2022 04:38 AM
The atmosphere was loaded with water vapor on Sunday and slow moving thunderstorms were able to efficiently produce significant amounts of rain over Iowa. The featured map presents the combination of NOAA MRMS estimates and the most recent US Drought Monitor. With Iowa book-ended by areas of drought, it is interesting to see the largest rainfall amounts falling between those two areas. Northwest Iowa was rather unlucky again with most missing out on significant rainfall totals. There are more chances of rain in the forecast this week, so hopefully the area can receive more substantial amounts.
Voting: Good - 16 Bad - 2
Generate This Chart on Website
Tue Jun 07, 2022

65+ Dew Points
07 Jun 2022 05:31 AM
For Ames, the increase in humidity on Monday was noticeable and a definite departure from much drier air to start off June. The featured chart presents the daily range in reported dew point temperature for Ames. Days with the range touching at least 65 degrees are colored in red. These humid days have been limited so far, which is typical as sources of atmospheric water vapor like plant transpiration are limited during the start of the growing season.
Voting: Good - 11 Bad - 0
Generate This Chart on Website
Wed Jun 08, 2022

Sunday's Rain Efficiency
08 Jun 2022 05:30 AM
A daily feature earlier this week denoted how the big rainfall on Sunday largely missed the most drought stricken portions of the state. The featured chart today looks at Sunday's rainfall efficiency when compared against the previous 31 day departures based on NOAA MRMS precipitation estimates. The areal coverage of at least one inch of rainfall is partitioned into bins based on the previous 31 day departures. For example and taking the first bin combination, about 4% of the state was running at least three inches below average over the past 31 days and 1.5% of the state over that same area received at least an inch on Sunday. So the chart nicely shows that nearly the entire state had been running a bit short recently and the highest percentage of the inch rainfall fell in the 2 to 3 inch deficit region.
Voting: Good - 7 Bad - 0
Generate This Chart on Website
Thu Jun 09, 2022

Pleasant June Dew Points
09 Jun 2022 05:30 AM
After some morning rainfall moved through, very pleasant air visited the state along with clearing skies. Dew point temperatures dropped to very pleasant values as well. The featured chart presents a wind rose for Des Moines during June when the dew point temperature is below 50 degrees Fahrenheit. The dominant directions from the NW are expected as this would represent less humid air masses than those from the south. Consider enjoying this weather while it lasts as forecast models continue to advertise much hotter and more humid conditions next week.
Voting: Good - 13 Bad - 0
Generate This Chart on Website
Fri Jun 10, 2022

Still Dry for Year to Date
10 Jun 2022 05:30 AM
The weekly update to the US Drought Monitor was released yesterday and did not show much for improvement over Iowa, even with some recent and needed rainfall over the drought areas. For the driest areas of the state over northwestern and southeastern Iowa, the recent rainfalls have not made much of a dent in longer term dryness. The featured map presents IEM estimated percent of average precipitation for the year to date period. Much of the state is shown below 100%, which means a below average accumulation. The driest areas on this map align well with the current drought depiction. Chances of rain continue to be in the forecast, but so is much warmer weather. The limited very hot weather so far this season has helped to mitigate problems over the drought area, so an increase in temperature will likely start to show more impacts from the below average precipitation.
Voting: Good - 14 Bad - 1
Generate This Chart on Website
Mon Jun 13, 2022

YTD Max Daily High
13 Jun 2022 05:30 AM
A taste of full blown summer arrived on Sunday with the knobs for heat and humidity both being turned to the right. The heat and humidity will build and mostly stick around this week. For air temperature and for Ames, we are about at average for the warmest daily high temperature for the year to date (YTD) period as shown by the featured chart. The chart presents the accumulated 2022 value along with statistical values for period of record data for the site. The jump up in early May, shown nicely on the chart, was quite noticeable after the chilly spring season.
Voting: Good - 10 Bad - 0
Generate This Chart on Website
Tue Jun 14, 2022

2022 Stress Degree Days
14 Jun 2022 05:30 AM
While far northeastern Iowa missed out on the very hot temperatures thanks to morning storms and being on the north side of the staled boundary, everybody got in on the tropical humidity levels with dew points well into the 70s and even a few 80 degree reports. One simple measure of heat magnitude is a computed metric called stress degree days. This daily value is typically defined as the high temperature minus 86 Fahrenheit. The featured chart presents the daily climatology and 2022 values for Ames. The accumulation for the previous day is noticeably higher than any previous day this year and at the high end of what's possible this time of year. The peak accumulation of this metric is certainly during the months of July and into August. While recent rains are helping to increase humidity and thus the miserable nature of our present heat spell, they are also helping newly sprouted crops with available soil moisture to help mitigate the present accumulation of stress degree days.
Voting: Good - 12 Bad - 1
Generate This Chart on Website
Wed Jun 15, 2022

Ring of Fire MCS
15 Jun 2022 05:30 AM
The classic usage of the "Ring of Fire" term relates to the map presentation of the line of active volcano and earthquake activity that rings much of the Pacific Ocean, or maybe the hit song by Johnny Cash. Meteorologists like to borrow this term to describe the path Mesoscale Convective Systems (MCS) will take around strong high pressure systems during the summer time. The edge of the high pressure systems is where temperatures are cool enough aloft to allow free convection and release of the high energy air (warm + moist) being generated within the high pressure regime. Storms will seemingly "ride" this boundary as moving away from the high features less unstable air and moving toward the high features too warm of air aloft to allow storms. Such was the case yesterday with a storm complex maturing Monday afternoon over Wisconsin and then travelling SE and eventually making an interesting SW dive across Georgia on Tuesday. The featured map presents an IEM computed "maximum base reflectivity" from a NWS NEXRAD mosaic. Effectively all of the 5 minute mosaics are overlain with the strongest values of the period retained. The map is valid for a period between 7 PM Monday and 7 PM Tuesday CDT. The map nicely shows the "ring" presentation with the path of the storms readily seen around the high pressure system.
Voting: Good - 18 Bad - 2
Generate This Chart on Website
Thu Jun 16, 2022

Minor Ames Flooding
16 Jun 2022 05:30 AM
Training thunderstorms dropped a stripe of heavy rainfall over Boone and Story County early Wednesday morning. The featured map presents NOAA MRMS precipitation estimates between noon on Tuesday and noon on Wednesday. Available precipitation observations are overlaid as taken from NWS COOP, Local Storm, and CoCoRaHS reports. Minor flooding was observed in Ames with both the Ioway Creek and Skunk River at or just above bankfull. Ames likely lucked out somewhat with the heaviest totals in the 4 to 5 inch range missing the river basins to the west and east.
Voting: Good - 14 Bad - 1
Tags: amesflood
Fri Jun 17, 2022

Drought Dots
17 Jun 2022 05:30 AM
The weekly update to the US Drought Monitor was released yesterday with both small improvements and degradation found with the analysis for Iowa. The authoring of the Drought Monitor is a difficult process as precipitation is highly variable in space and time. For example, it is sometimes difficult to balance long term dryness vs short term wetness and arrive at a single drought classification for a given area. The featured map is a new data visualization attempt by the IEM to illustrate the sometimes conflicting precipitation departures over space and time. The colored polygons represent the current US Drought Monitor analysis. For each of the long term climate sites tracked by the IEM, three dots are generated and colored by their standardized precipitation index (SPI) value over 30, 90 and 180 days. The dots are colored using a simple SPI to drought classification cross reference. When SPI is positive, associated "wet" (W classifications) colors are used. So what does this plot show us? For starters, only a small portion of central Iowa has above average precipitation over all three of these intervals. There are developing pockets of dryness over southern Iowa that will likely require introduction of drought classifications if rains do not come. While the worst drought analysis exists over northwestern Iowa, departures are variable over different periods. What do you think of this visualization? You can generate it on-demand via the "generate this chart" link, but be warned that the generation is very slow!
Voting: Good - 13 Bad - 1
Generate This Chart on Website
Mon Jun 20, 2022

Concerning Map
20 Jun 2022 05:30 AM
The featured map presents the combination of Weather Prediction Center forecast precipitation over the next seven days and the most recent US Drought Monitor analysis. You may recall the featured map from Friday noticing that dryness is starting to develop over southern Iowa, and for that matter, over much of the rest of the state outside of parts of central Iowa as well. A generally wet enough spring season and crops eager for warmth and sunshine have made the past few days near ideal. Persistent heat and limited rainfall going forward posses a problem though, which is what is forecast for this week. If there is any good news, there will be chances of rainfall, so the featured map could certainly be more concerning than it already is.
Voting: Good - 10 Bad - 0
Generate This Chart on Website
Tue Jun 21, 2022

Streak of Slight Risk
21 Jun 2022 05:33 AM
As of the time publishing this featured chart, the Storm Prediction Center has just a marginal risk of severe weather forecast as the highest risk category for today over the contiguous US. If this were to hold through the day without any upgrades to a slight risk, it would be the first time since 25 April without at least a slight risk forecast. Of course, April through June are the prime months for severe weather in this country, so having such a streak this time of year makes sense. The featured chart presents the maximum risk category since 1 March this year. An obvious question is has such a streak happened before? Unfortunately, an answer is not straight forward as the threat categories have slightly changed over the years.
Updated: SPC issued a slight risk with the 11:30 AM update, so the streak continues for another day!
Voting: Good - 18 Bad - 1
Tags: spc
Generate This Chart on Website
Wed Jun 22, 2022

High Water Demand
22 Jun 2022 05:34 AM
The featured map presents ISU Soil Moisture Network computed potential evapotranspiration over the past seven days. The value is expressed in inches of water and represents an estimate of the maximum demand of water from vegetation assuming that the vegetation has water to spare. Some refer to this as a reference value as in this case, the reference crop is Alfalfa. Warm and windy weather along with plenty of sunshine have really dried things out over the past number of days. Signs of drought stress will certainly show up soon over much of the state unless more widespread rains are come soon given this elevated demand for water.
Voting: Good - 11 Bad - 0
Generate This Chart on Website
Thu Jun 23, 2022

Clear Skies Impact on Temps
23 Jun 2022 05:30 AM
Being now one day removed from the longest day of the year, it makes sense that another day with mostly clear skies was able to support warm daytime temperatures thanks to ample heating. The effect of having clear skies on temperatures is featured with today's chart. The chart compares hourly temperatures by week of the year for Des Moines between the case of having clear skies reported against all other reports. Yes, there are some caveats with how an automated station can report clear skies, but the chart nicely shows the intuitive relationship and some neat annual quirks. The red areas of the chart indicate that air temperatures are, on average, warmer during clear skies than not and green vice versa. The impact of daytime heating of the sun is immediately obvious, but you may notice the opposite impact during the winter months. Clouds during the winter months are typically a positive for temperatures as heat from the surface is absorbed and re-transmitted back to the ground helping to buoy temperatures. There's also a very nice negative influence on temperature just before sunrise as again the absence of clouds during the overnight hours allow temperatures to cool with the peak accumulated cooling happening just before sunrise.
Voting: Good - 9 Bad - 0
Generate This Chart on Website
Fri Jun 24, 2022

Noon Pavement Temps
24 Jun 2022 05:30 AM
Today's featured chart takes a look at roadway pavement temperatures based on the Iowa DOT RWIS station in Ames along Interstate 35. With peak insolation at hand, one may wonder if pavement temperatures also peak at this time? The featured chart indicates, that like soil and air temperatures, there is a bit of a thermal lag with the maximum temperatures observed during July. Indeed, pavement temperatures are supported by warming soils, so as the soils continue to warm with the summer season, less of the heating from the sun is lost to transfer into the soil below the pavement. If the relationship was this simple, perhaps some of the bumps in the annual curve need some more explanation. Two of the bumps in March and November are related to a processing quirk with this plot representing either noon standard or daylight time, so there's an artificial bump at those locations. What's happening during the end of August is not necessarily straight forward, but perhaps related to local soil types and perhaps the slope of the pavement surface to the sun or maybe even prevalent shadows at that hour.
Voting: Good - 16 Bad - 1
Tags: pavement
Mon Jun 27, 2022

Cedar Rapids Record Rainfall
27 Jun 2022 05:30 AM
Some much needed rain fell over Iowa on Saturday, with the official site in Cedar Rapids (at the airport) reporting 2.99 inches of rain. This established a new daily record for the site. The featured chart presents one minute interval precipitation from the site between 1 and 8 AM. A bit more precipitation was reported after this chart ends, thus why the reported total does not exactly match. Anyway, the chart also computes the hourly precipitation rates based on extrapolating minute or 15 minute interval totals. It shows shows the actual hourly rates based on 60 minute interval data. The chart attempts to illustrate the rainfall rates involved with heavy precipitation events such as this one. With actual rates maxing out at about an inch per hour and the dry antecedent conditions, it is likely that much of this rainfall was happily soaked in by the ground.
Voting: Good - 10 Bad - 2
Generate This Chart on Website
Tue Jun 28, 2022

Flash Drought Concerns
28 Jun 2022 05:30 AM
The term "Flash Drought" has been receiving a fair bit of press coverage lately as some parts of the Midwest and Great Plains have turned dry and hot this June. The combination of climatological max precipitation accumulation with dry weather, highest solar radiation, warming soils and developing crops can combine to quickly turn marginally wet springs into significant moisture deficits that cause plant stress to appear. Such is the case over parts of Iowa that have missed out on recent June rainfalls. The featured chart presents data for Red Oak (far SW Iowa). The chart combines trailing 30, 91 and 180 day precipitation departures along with analyzed US Drought Monitor category at the time. The recent few weeks have seen a quick nose dive of all three precipitation metrics and will likely receive close attention with the weekly Drought Monitor update due on Thursday.
Voting: Good - 11 Bad - 0
Generate This Chart on Website
Wed Jun 29, 2022

Eastern Corn Belt Dive
29 Jun 2022 05:30 AM
The USDA NASS weekly update released on Monday painted a dire picture for degrading soil moisture status. The featured map presents the percentage of each state with a top soil moisture condition in either poor or very poor condition. The percentage points change from the previous week's number is included as well and is the key to the choropleth of the map. Outside of small improvements in Kansas and South Dakota, the rest of the Midwestern US degraded. The changes shown in Kentucky, Indiana, and Ohio are rather extreme and about as bad as it can get for a week over week change. The good news is that storm chances continue in the forecast, but their widespread nature remains in doubt.
Voting: Good - 12 Bad - 0
Generate This Chart on Website
Thu Jun 30, 2022
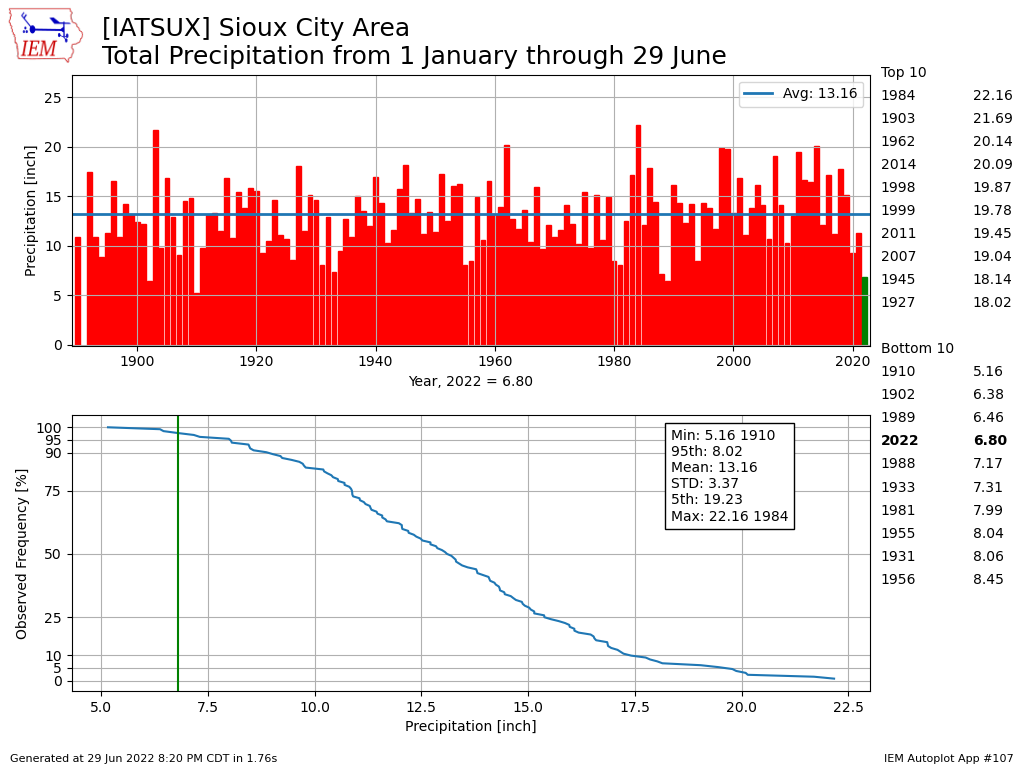
Sioux City Precipitation Woes
30 Jun 2022 05:13 AM
The Sioux City area remains one of the driest in Iowa and the weather on Wednesday was par for the course this year with a record high temperature of 100 degrees and completely missing out on limited rainfall chances overnight. The featured chart presents year to date precipitation totals for Sioux City with the 2022 value coming in fourth driest on record. Note that the 1891 total is omitted due to missing data for the month of June 1891. The 2022 value is even slightly below the 1988 total, which was an epic drought year for Iowa. Rain chances continue to be in the forecast, but it remains to be seen how much of this rain will fall over northwestern Iowa.
Voting: Good - 12 Bad - 0
Generate This Chart on Website