Past Features
This page lists out the IEM Daily Features for a month at a time. Features have been posted on most days since February 2002. List all feature titles.
Sun Jan 02, 2022
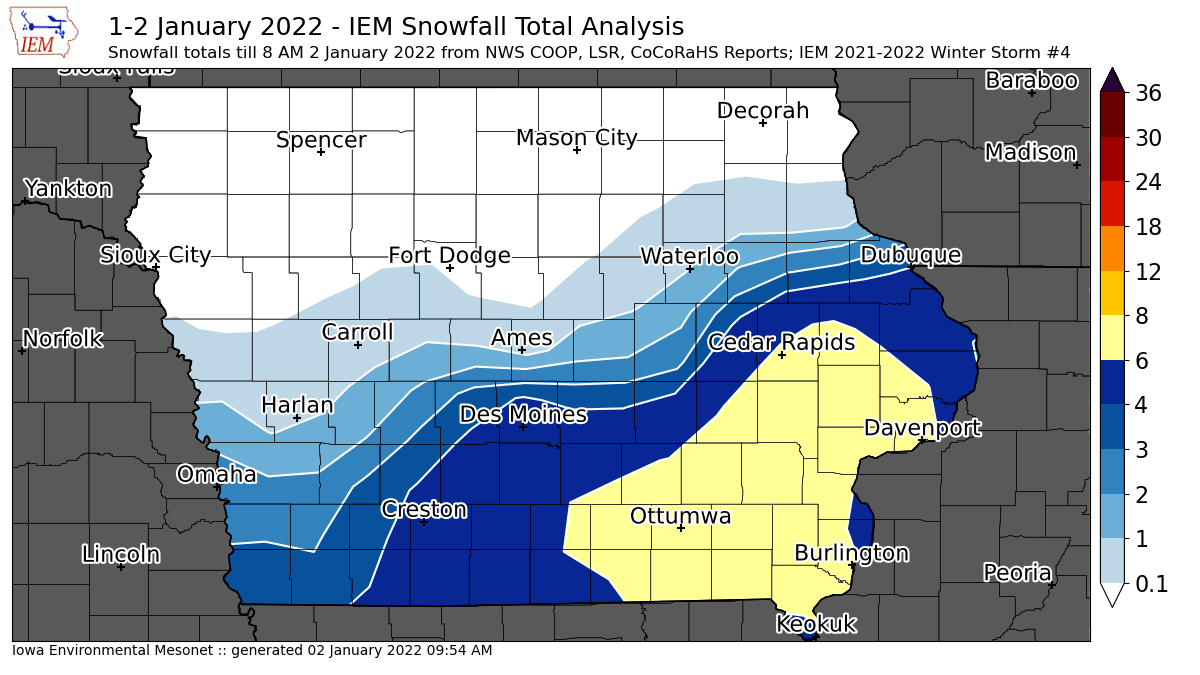
'21-'22 Winter Storm #4
02 Jan 2022 09:57 AM
The new year got off to a snowy and cold start with heavy snowfall totals reported over southeastern Iowa. The featured map presents a smoothed analysis of available NWS and CoCoRaHS reports. There were a few isolated reports of eight inches. The north side gradient shown on this map was likely a bit tighter than indicated with much of northern Iowa missing out completely on the snow. Nobody is missing out on the bitter cold temperatures this Sunday with even a slight breeze creating for dangerous wind chill temperatures.
Voting: Good - 18 Bad - 1
Tags: winter2122
Mon Jan 03, 2022
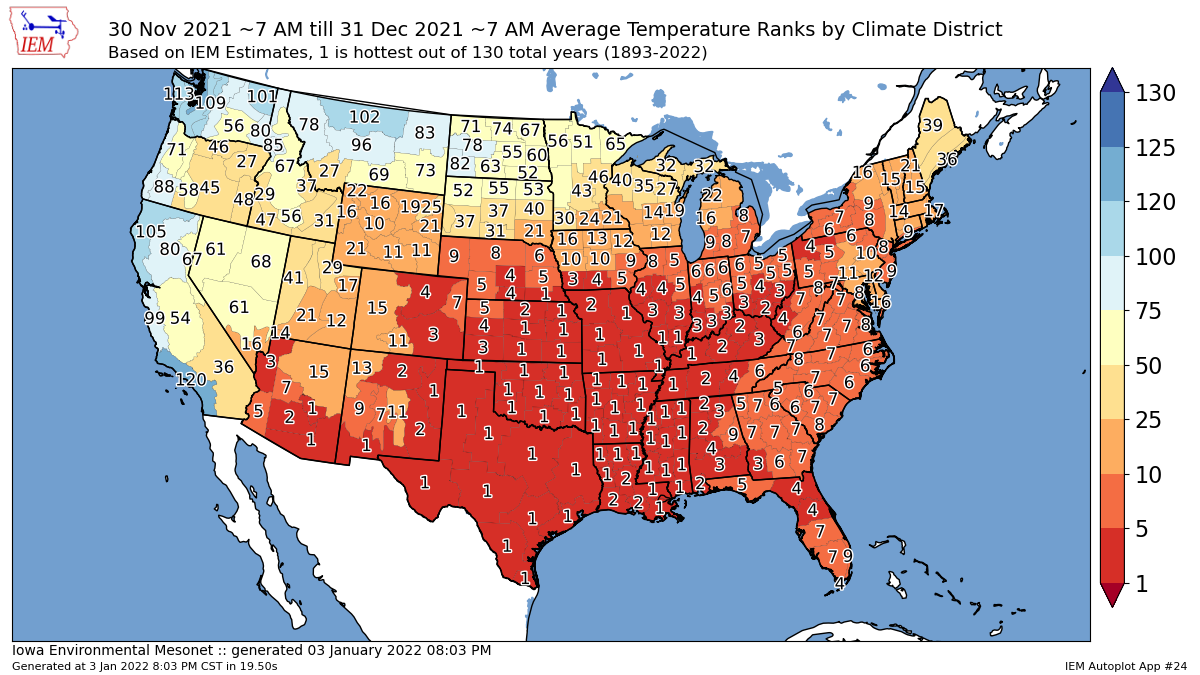
Warm December
03 Jan 2022 08:10 PM
With all the excitement of the 15 December storm and recent snow producing winter storms, the IEM Daily Feature needs to catch up on some of the highlights of 2021. Today's map takes a look at IEM climate district ranks for average December temperature. A value of one indicates the warmest December on record since at least 1893. These estimates are made by the IEM and not official, but other more official data correlates well. December was very warm for much of the country with Iowa within the transition zone to much cooler levels to our north and west. While a number of locations in Iowa set all time December record daily high temperatures on 15th, this map looks at the month on average. The winter season thus far has seen some extreme temperature gradients present over the contiguous US, which has driven some very extreme winds aloft.
Voting: Good - 15 Bad - 0
Tags: dec21
Generate This Chart on Website
Tue Jan 04, 2022
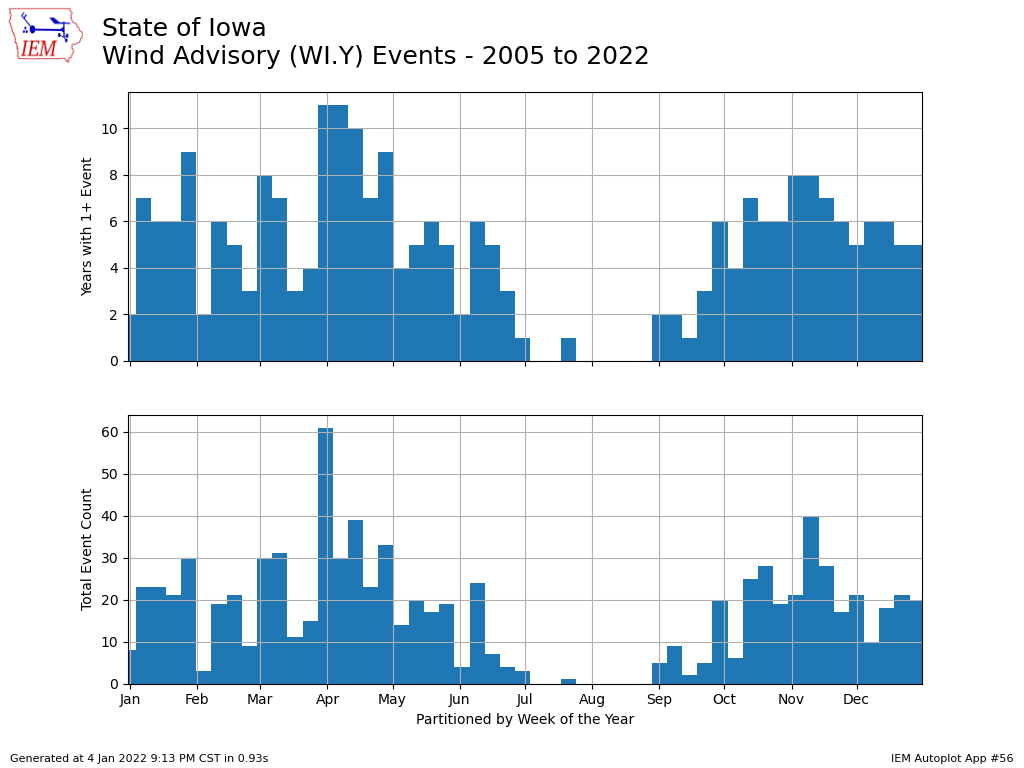
Wind Advisories by Week
04 Jan 2022 09:20 PM
Wind speeds have markedly increased this evening over Iowa with the passage of a cold front. The NWS has a Wind Advisory in place over portions of the state with gusts expected in the 40 to 50 MPH range until morning. The featured chart looks into the frequency of this advisory for Iowa by week of the year with the top panel showing the number of years since about 2005 that have seen at least one event and the bottom panel showing the total number of events. An event is defined by an individual issuance by a NWS forecast office. The chart shows that April is clearly the most active with only July and August being near void of this alert type.
Voting: Good - 13 Bad - 0
Generate This Chart on Website
Wed Jan 05, 2022
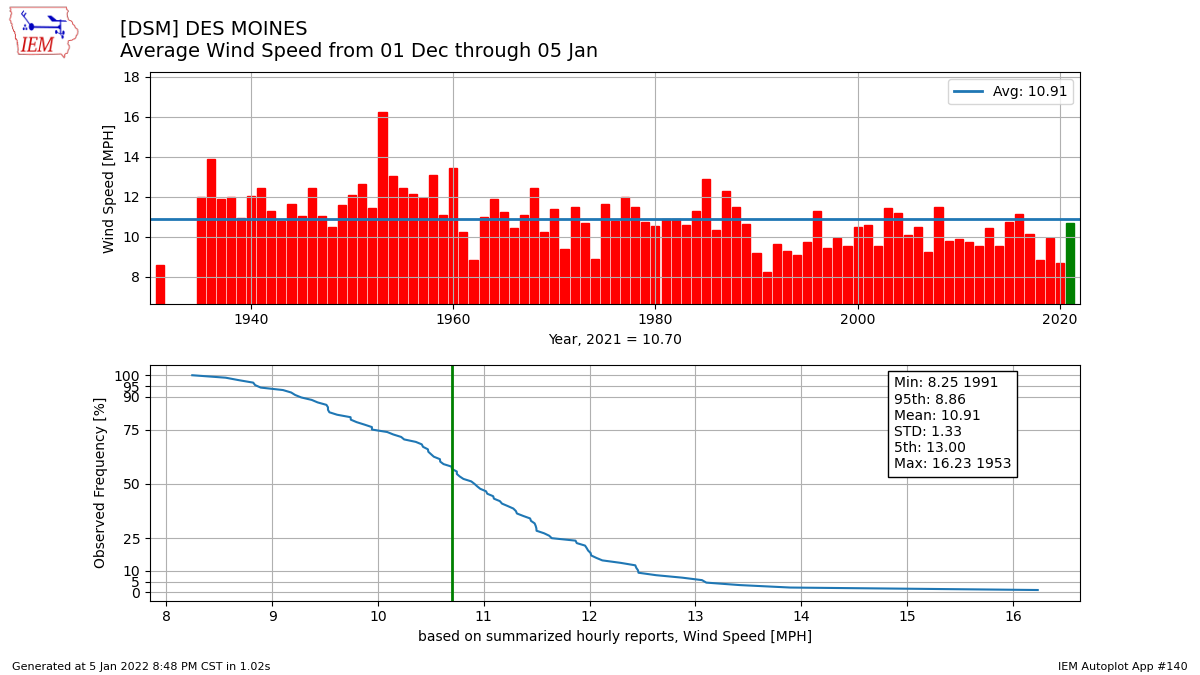
Windy Winter?
05 Jan 2022 09:13 PM
Winds were howling again on Wednesday and recency bias (like my usage of 'again' just a few words earlier) would seem to indicate it has been windier than average so far this winter season. When measured by average daily average wind speed, the featured chart would seem to indicate otherwise. The chart shows the average wind speed between 1 December and 5 January for Des Moines. There are caveats galore to a chart like this including that "average wind speed" isn't really something directly measured anymore. For the modern period, what we have are hourly or better reports of two minute average wind speed over 2 or 3 second samples. Sound confusing? It gets even worse when considering the change from a more traditional cup anemometer to a two or three dimensional sonic instrument. A first glance at the featured chart would imply that the 1940s and 1950s were windier than today, but again we have to consider changes to how wind speeds were reported back then. Putting aside the long term changes, even looking back just 10-20 years indicate that this season has not been anything exceptional.
Voting: Good - 10 Bad - 2
Tags: wind
Generate This Chart on Website
Thu Jan 06, 2022
Hours of Wind Chill
06 Jan 2022 09:25 PM
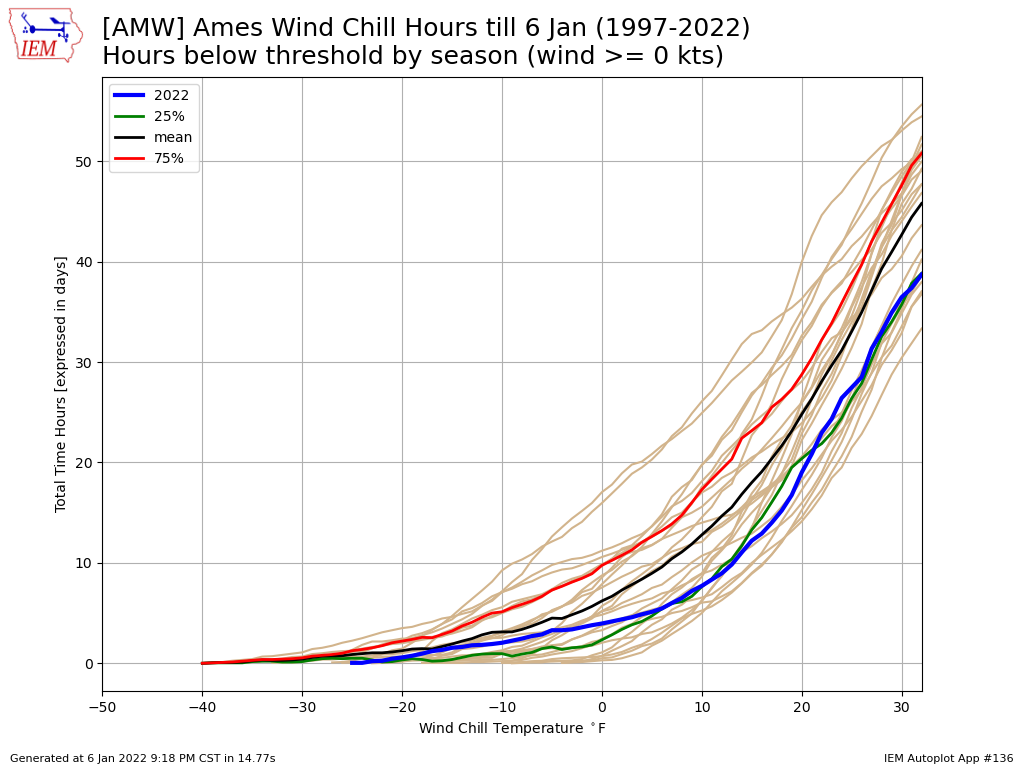
The thought of setting an all-time record high temperature during the month of December, just last month, is a bit of a far off memory given the plunge into the deep freeze this week. Wind chill temperatures today were well below 0F. The featured chart presents the number of accumulated hours with a wind chill temperature at or below the given threshold for Ames by season for the season to date period. The blue line shows the 2021-2022 accumulated total with each previous year on record plotted in tan along with selected percentile values. The accumulation this year has been below average for most thresholds. We will have another chilly today on Friday before a bit warmer weather moves in for the weekend and next week.
Voting: Good - 15 Bad - 1
Tags: windchill
Generate This Chart on Website
06 Jan 2022 09:25 PM
The thought of setting an all-time record high temperature during the month of December, just last month, is a bit of a far off memory given the plunge into the deep freeze this week. Wind chill temperatures today were well below 0F. The featured chart presents the number of accumulated hours with a wind chill temperature at or below the given threshold for Ames by season for the season to date period. The blue line shows the 2021-2022 accumulated total with each previous year on record plotted in tan along with selected percentile values. The accumulation this year has been below average for most thresholds. We will have another chilly today on Friday before a bit warmer weather moves in for the weekend and next week.
Voting: Good - 15 Bad - 1
Tags: windchill
Generate This Chart on Website
Mon Jan 10, 2022

Not much for snowfall
10 Jan 2022 05:38 AM
While it took a while before Iowa received its first snowfall of the season, the few storms thus far have not equally blanketed the state with snow. The featured map presents the NOHRSC snowfall analysis for the season to date. The snowfall "winner" thus far is east-central Iowa. The forecast for this week does not have much hope for more snowfall with rather pleasant temperatures in store. On average, this week should be the coldest of the season climatologically, so we have fared rather well this winter so far.
Voting: Good - 13 Bad - 0
Generate This Chart on Website
Tue Jan 11, 2022

Ames Ceilings
11 Jan 2022 05:34 AM
Those of you around Ames may have noticed a brief period Monday morning with overcast skies. The automated weather station at the Ames airport has a sensor that attempts to estimate cloud coverage amounts at height. During this period, it was reporting overcast conditions at about eight thousand feet above ground level. The featured chart presents the frequency by week of the year that such overcast conditions are reported at a given height. This plot should be considered with a grain of salt as it is reproducing some intrinsic properties of the automated sensor at use rather than a climatology of cloud ceilings. For example, the sensor is limited to twelve thousand feet with nothing reported above that level. There are also some quirks with how overcast is reported above five thousand feet. So after all these quirks, does the plot have any value?!?! Well, yes as a nice annual signal is presented with a decrease in overcast conditions shown during the warm portion of the year. Increased heating and better deeper lower atmospheric mixing help to keep overcast conditions away from the near surface.
Voting: Good - 10 Bad - 0
Tags: ceilings
Generate This Chart on Website
Wed Jan 12, 2022
Snow Period Ending
12 Jan 2022 05:32 AM
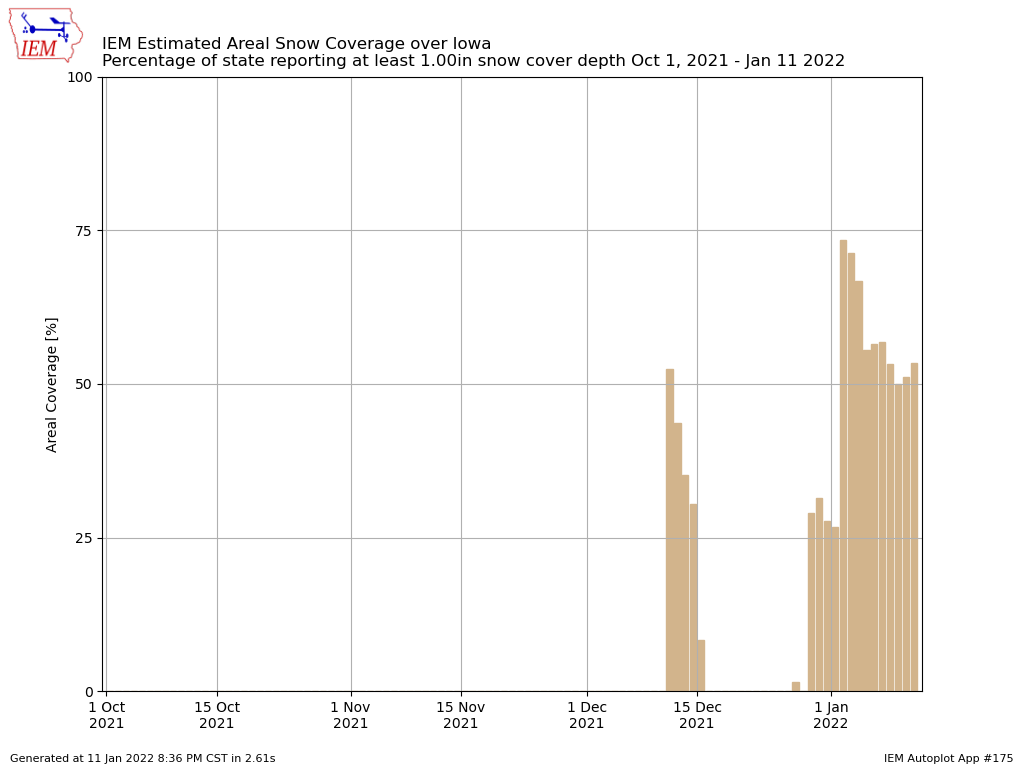
Temperatures nicely soared on Tuesday to the warmest values seen so far this year with highs in the 40s and 50s. Due to the lack of snow cover there, Sioux City was able to set a new record high temperature for the date of 58 degrees. The warm air is expected to stick around a few more days and will make quick work of the remaining snow cover over the state. The featured chart presents a daily analysis of areal coverage of snow depth of at least an inch over Iowa. Today's value will post later today on this chart and likely show not much left. In general, amounts have been meager this winter season with a very late start to the first significant snowfall and then a period of warm weather during December. You snow lovers take heart as the forecast models continue to advertise a significant snowfall later this week. The rest of you should enjoy these warm temperatures while they last!
Voting: Good - 16 Bad - 0
Tags: snowcover
Generate This Chart on Website
12 Jan 2022 05:32 AM
Temperatures nicely soared on Tuesday to the warmest values seen so far this year with highs in the 40s and 50s. Due to the lack of snow cover there, Sioux City was able to set a new record high temperature for the date of 58 degrees. The warm air is expected to stick around a few more days and will make quick work of the remaining snow cover over the state. The featured chart presents a daily analysis of areal coverage of snow depth of at least an inch over Iowa. Today's value will post later today on this chart and likely show not much left. In general, amounts have been meager this winter season with a very late start to the first significant snowfall and then a period of warm weather during December. You snow lovers take heart as the forecast models continue to advertise a significant snowfall later this week. The rest of you should enjoy these warm temperatures while they last!
Voting: Good - 16 Bad - 0
Tags: snowcover
Generate This Chart on Website
Thu Jan 13, 2022

January Treat
13 Jan 2022 05:40 AM
Temperatures on Wednesday were another treat for this time of year with highs in the 40s and 50s as shown by the featured map of high and low temperatures from the ISU Soil Moisture Network stations. Climatology says this week, on average, should be the coldest of the year, so having such warm values is definitely a treat. The forecast focus continues to be on the winter storm for Friday with significant snowfall totals expected over northwestern to central Iowa.
Voting: Good - 11 Bad - 2
Generate This Chart on Website
Fri Jan 14, 2022
Big Snow is Here
14 Jan 2022 05:41 AM
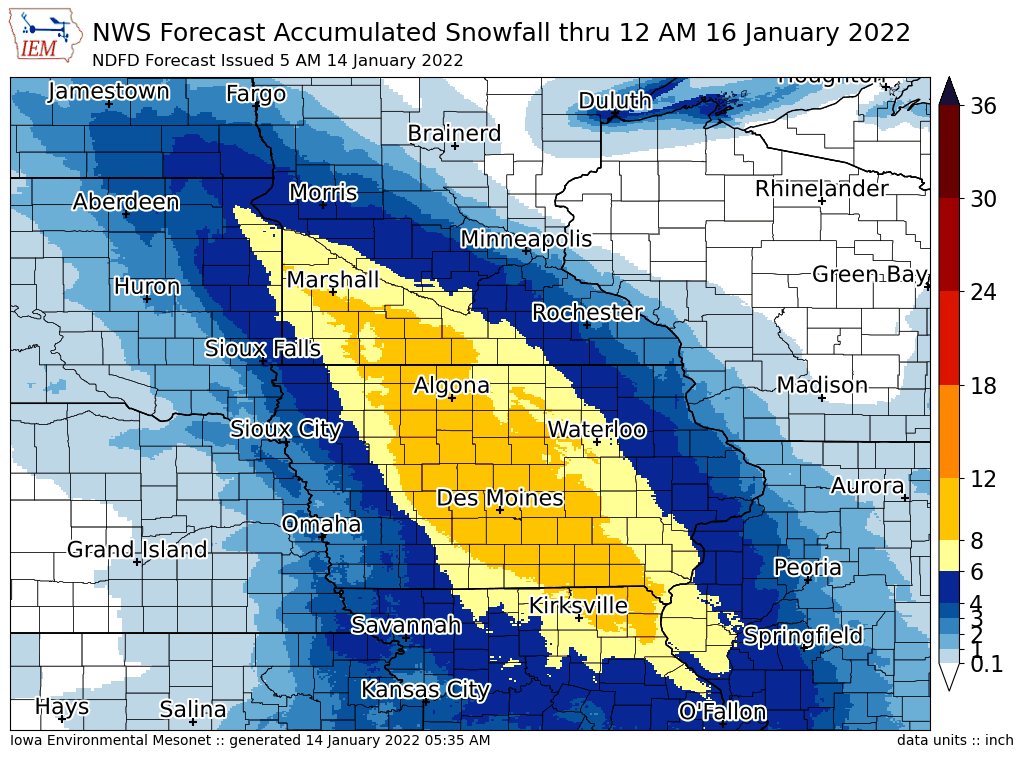
The snowfall event is underway with accumulations already reported over northern Iowa. The featured map presents the NWS forecast via the National Digital Forecast Database (NDFD) for the period ending Saturday night. The yellow and orange area paints a six to twelve inch stripe over much of the state. The snow to liquid ratio is expected to be low, which means the snow will be heavy to push around for clearing. You'll find a map like this in the upper right corner of the homepage during the event, summarizing reports that are received by the NWS. Snow lovers, rejoice!
Voting: Good - 24 Bad - 1
14 Jan 2022 05:41 AM
The snowfall event is underway with accumulations already reported over northern Iowa. The featured map presents the NWS forecast via the National Digital Forecast Database (NDFD) for the period ending Saturday night. The yellow and orange area paints a six to twelve inch stripe over much of the state. The snow to liquid ratio is expected to be low, which means the snow will be heavy to push around for clearing. You'll find a map like this in the upper right corner of the homepage during the event, summarizing reports that are received by the NWS. Snow lovers, rejoice!
Voting: Good - 24 Bad - 1
Sat Jan 15, 2022

'21-'22 Winter Storm #5
15 Jan 2022 09:35 AM
The forecast of a stripe of very heavy snowfall from northwestern through central Iowa panned out with the featured map presenting received reports from the NWS and CoCoRaHS so far. There have been a few isolated reports of a foot of snow, but not enough to show up on this smoothed presentation. Snowfall totals dropped off rapidly to the west and east with just an inch or so found over far eastern and western Iowa. The snow was loaded with water, so it made for a painful removal process.
Voting: Good - 21 Bad - 1
Tags: winter2122
Sun Jan 16, 2022
Hunga Tonga Eruption Sonic Wave
16 Jan 2022 08:47 PM
Late Friday evening (Iowa time), a massive volcanic eruption happened near Tongo, a place north and east of New Zealand. The eruption generated a shock wave / sonic waves in the air that have continued to transverse the globe up until at least the time of this writing. Like waves you see in water, these waves create vertical displacements of air causing surface air pressure fluctuations. The featured movie presents an animation of minute interval pressure data observed from NWS/FAA ASOS stations. The data is presented in the form of "sparklines". Each line represents the map location of an observation time series lasting 15 minutes. The north/south variation in the line represents a change in pressure with the color being the magnitude over the 15 minutes. As you play the movie, you can at least readily notice the propagation of the wave across the country. Others on the Internet have computed this wave to be traveling at approximately the speed of sound! There are many other nuances that can be seen in the plot, including many smaller waves coming after the first wave. So, do you know what is even crazier? There was another wave transversal earlier this Sunday morning from east to west as the initial wave from Tonga made its way east around the globe and arrived at the USA. The one minute data is not available from it yet, so check back later for another lapse from it.
Voting: Good - 24 Bad - 0
Tags: tonga volcano pressure
Mon Jan 17, 2022
Tonga wave passage #2
17 Jan 2022 07:56 PM
Yesterday's daily feature presented a sparkline map showing the passage of waves from the Hunga Tonga volcano eruption. Today's map presents the second wave passage event over the contiguous US, this one traversed the globe in the other direction and so arriving on the east coast first. This lapse is from early Sunday morning and guess what, there are still more lapses to be shown as the waves continue to propagate around the globe. It is unclear when these waves will disappear, but given the size of the eruption and some limited literature on previous documented events, it is likely soon. So these waves are not really impacting sensible weather any, but are certainly extremely interesting! Qualitatively, it seems like this wave strength was stronger, but the reasons are not clear and maybe an artifact of time of day and/or how this particular metric is being presented here.
Voting: Good - 23 Bad - 0
Tags: tonga volcano pressure
Tue Jan 18, 2022
Tonga wave passage #3
18 Jan 2022 08:38 PM
You'll have to pardon the continued featuring of wave passages from the Hunga Tonga eruption. This featured lapse shows the second passage of the eastbound wave that happened Sunday evening. While the wave is plainly visible, it is not as strong as the first passage. There are interesting quirks with how qualitatively strong the wave appears over various parts of the country. The reason for these differences is not readily known by the author at this time! We'll have at least one more lapse to share as the second passage of the westbound wave happened Monday afternoon. It is a testament to the power of a volcanic eruption that these waves are able to make multiple trips around the globe!
Voting: Good - 4 Bad - 0
Tags: tonga volcano pressure
Wed Jan 19, 2022
Tonga wave passage #4
19 Jan 2022 05:25 AM
Continuing the series of feature posts showing the passages of waves associated with the Hunga Tonga volcanic eruption. This lapse shows the second passage of the westbound wave. There are many interesting aspects shown by this plot including smaller waves out ahead of the largest amplitude wave and again, the westbound wave looks subjectively stronger than the eastbound wave did. I think we'll stop with the IEM Daily Features showing these wave passages and relegate the subsequent posts to my @akrherz Twitter page as we'll perhaps catch a third passage of each! Focus needs to turn back to the dangerous cold wind chills and return to the deep freeze with temperatures over Iowa!
Voting: Good - 20 Bad - 0
Tags: tonga volcano pressure
Thu Jan 20, 2022

62 to 19
20 Jan 2022 05:34 AM
Thanks to a lack of snow cover, Sioux City was able to reach a high of 62 degrees on Tuesday and establish a new record for the date. A strong cold front significantly dropped temperatures into Wednesday with the high temperature of only 19 degrees set at midnight. The featured chart presents the daily high and low temperatures for the site along with the climatology. The site has seen some wild variability with a difference of 57 degrees between the warmest high (62) and coldest high (5) for the month. The near term forecast keeps us on the cold end of this range with no significant warm-ups expected.
Voting: Good - 18 Bad - 0
Tags: jan22
Generate This Chart on Website
Fri Jan 21, 2022
Wind Chilly Thursday
21 Jan 2022 05:32 AM
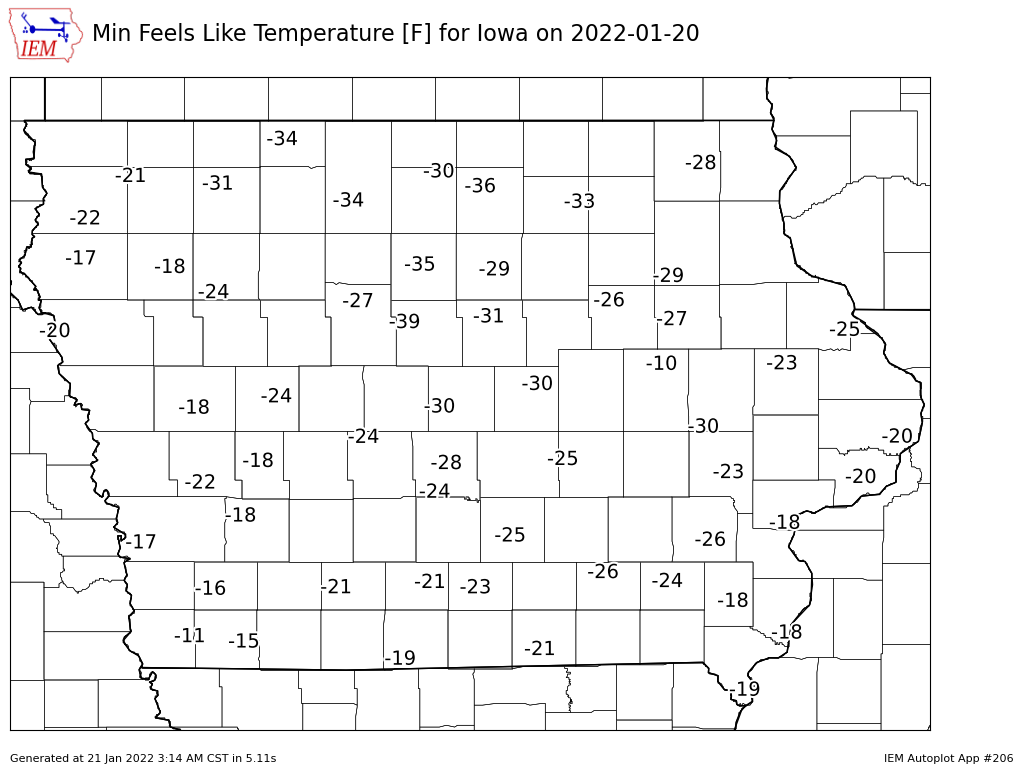
Iowa had perhaps its coldest day so far this winter season on Thursday with high temperatures generally in the single digits and lows well below zero. The featured map presents IEM computed minimum wind chill temperatures from airport weather stations. Values below -30 can be found over portions of northern Iowa. Friday will start off in a similar manner to Thursday with dangerous wind chills and well below zero temperatures, but will be slightly warmer during the afternoon hours. The near term forecast continues to look cold with perhaps a warm up by the end of next week.
Voting: Good - 12 Bad - 0
Generate This Chart on Website
21 Jan 2022 05:32 AM
Iowa had perhaps its coldest day so far this winter season on Thursday with high temperatures generally in the single digits and lows well below zero. The featured map presents IEM computed minimum wind chill temperatures from airport weather stations. Values below -30 can be found over portions of northern Iowa. Friday will start off in a similar manner to Thursday with dangerous wind chills and well below zero temperatures, but will be slightly warmer during the afternoon hours. The near term forecast continues to look cold with perhaps a warm up by the end of next week.
Voting: Good - 12 Bad - 0
Generate This Chart on Website
Sun Jan 23, 2022

'21-'22 Winter Storm #6
23 Jan 2022 10:45 AM
Folks in far northeastern Iowa were the lucky ones this weekend to pick up accumulating snowfall. Values in the four to six inch range were isolated to the far corner of the state with amounts rapidly dropping off to the south and west. The featured map presents available NWS observations along with CoCoRaHS reports. A round of very light snowfall is forecast over northern Iowa tonight, but is not expected to amount to a whole lot.
Voting: Good - 10 Bad - 0
Tags: winter2122
Tue Jan 25, 2022

January below Zero
25 Jan 2022 05:29 AM
Our brief respite from bitter cold temperatures last week is over with a return of deep freeze conditions last night. Temperatures are again below 0 Fahrenheit with even colder temperatures expected Tuesday night. The featured chart presents the number of hours each January with a temperature below zero for Des Moines. This metric is computed based on available hourly temperatures. The total for this year is highlighted in blue as the month total is still in progress. Of note is that the total for last year's January was zero! The total for this year isn't too out of line versus previous years. The bottom panel presents the number of days for the month with such a temperature at the given hour. The total there for 2022 shows no days this year with afternoon temperatures that cold, so certainly things could be worse!
Voting: Good - 10 Bad - 0
Tags: jan belowzero
Generate This Chart on Website
Wed Jan 26, 2022
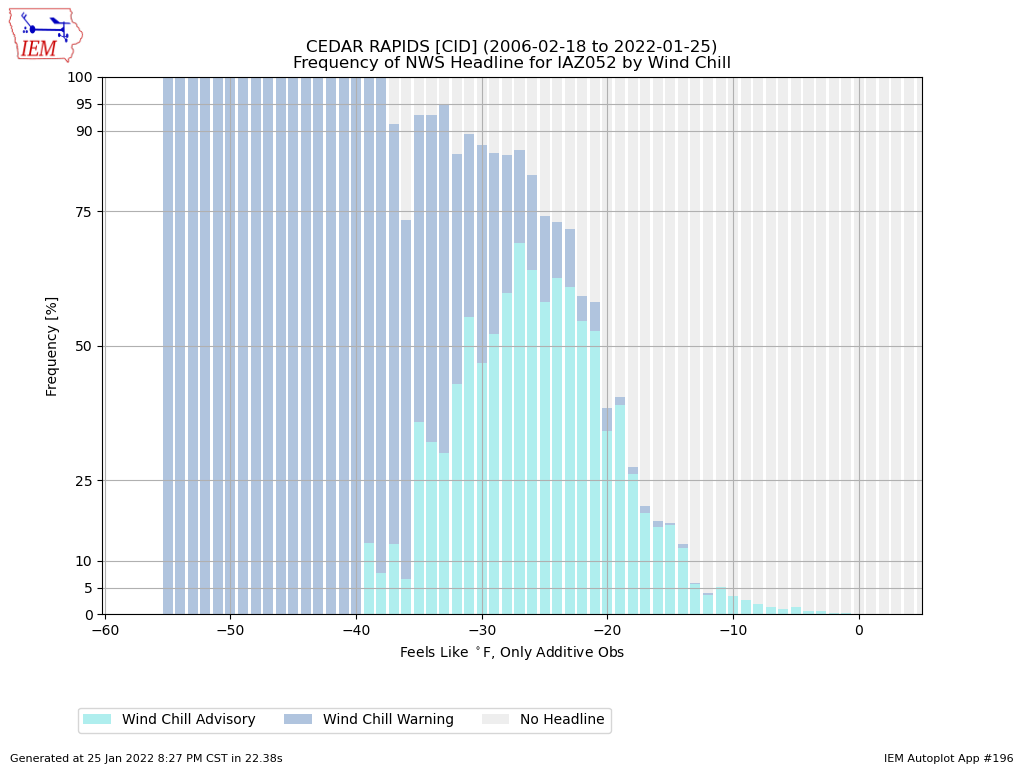
Cedar Rapids Wind Chill Warning
26 Jan 2022 05:34 AM
Wind chill temperatures this Wednesday morning are brutal with air temperatures well below zero and a brisk NW wind pushing values even further below zero over Iowa. The NWS has a Wind Chill Warning in effect primarily over northeastern Iowa covering locations like Cedar Rapids. The featured chart presents the frequency of having either a Wind Chill Advisory or Warning active at a given wind chill temperature since early 2006 for Cedar Rapids. The chart nicely delineates the thresholds at which these warning/advisory events are issued at. Values below -20 are mostly covered by the advisory with values below -30 and particularly below -35/-40 covered by the warning. One can hope this is the worst that this winter will have to offer, but there is still plenty more time to go!
Voting: Good - 9 Bad - 0
Tags: windchill
Generate This Chart on Website
Thu Jan 27, 2022

Largest 12 Hour Rises
27 Jan 2022 05:33 AM
After starting Wednesday morning off with very cold temperatures over much of the state, wind switched around to the southwest and rapid warming took place with sites like Estherville and Spencer warming more than 50 degrees for the day! The featured chart presents the largest twelve hour rises for Estherville based on available hourly data back to 1987. The second and tenth entries shown on this chart happened on Wednesday with the 3 AM temperature of -20 warming to 29 degrees at 3 PM and similarly for the 5 AM to 5 PM value. It is interesting to denote that the other largest warm-ups shown happened during May and October, during which dry air can help lead to rapid cooling at night and heating during the day.
Voting: Good - 11 Bad - 0
Generate This Chart on Website
Fri Jan 28, 2022

Cold Month
28 Jan 2022 05:33 AM
Air and wind chill temperatures are again back to cold for January levels this Friday morning after a brief respite near freezing on Thursday. The featured chart presents a time series of computed wind chill temperature for Ames since the first of the month. The vast majority of time this month has been spend at below freezing wind chill temperatures. The past two weeks have seen some very cold dips below -20. Of course, January is the coldest month of the year, so such weather is to be expected.
Voting: Good - 13 Bad - 0
Generate This Chart on Website
Mon Jan 31, 2022

East to West Difference
31 Jan 2022 05:31 AM
With the end of the month at hand, it is a good time to look back on the first month of 2022. The featured map presents an IEM computed average temperature departure for the month. Interestingly, the map shows an east to west gradient with extreme portions of western Iowa slightly above average with the rest of the state below. Some of this gradient can be explained by the ongoing La Nina condition with favors colder temperatures over eastern Iowa. It can also be explained by the lack of snow cover over far western Iowa, which has allowed for more warmer daytime temperatures. The case in point will be today with very pleasant highs in the 50s expected over far western Iowa and values closer to freezing in eastern Iowa.
Voting: Good - 14 Bad - 0
Generate This Chart on Website