Past Features
This page lists out the IEM Daily Features for a month at a time. Features have been posted on most days since February 2002. List all feature titles.
Mon Nov 01, 2021

Finally, a positive departure
01 Nov 2021 05:37 AM
The featured chart presents monthly precipitation departures from average for Cedar Rapids since 2019 along with concurrent El Nino 3.4 index values. This past October's departure was the largest positive departure for the site since May 2019 and the first positive departure since January! While the recent rains have slowed down harvest progress, the rain has put a significant dent in the ongoing drought situation over the state. The forecast for this week looks dry and rather chilly with highs in the 40s and lows in the 20s.
Voting: Good - 12 Bad - 0
Generate This Chart on Website
Tue Nov 02, 2021

Clustering near Freezing
02 Nov 2021 05:33 AM
The featured chart presents some statistical metrics for the distribution of reported high and low temperatures for all long term climate sites tracked in Iowa by the IEM on 2 November. There is no spatial nor temporal weighting done, it is just a simple accounting of what's available for the date. The stepped lines are histograms for each degree value and the dashed lines represent a "normal distribution" based on the calculated mean and standard deviation. The chart illustrates some neat concepts for the weather we get this time of year. The most interesting to me is the amount of population over the theoretical distribution at about 32 degrees for low temperature. There is a physical reasoning for this! Soil temperatures are typically above freezing and along with some meager vegetation that still may have some liquid water content present. So it takes a lot of cooling to power through this thermal resistance that happens near freezing with the release of heat that happens when water freezes. So this resistance becomes a biased settling place for low temperatures to prefer. The vast majority of high temperatures are above this level and along with aforementioned above freezing soil temperatures and little snowfall, the distribution is much smoother.
Voting: Good - 13 Bad - 0
Generate This Chart on Website
Wed Nov 03, 2021

Nov vs Oct Highs
03 Nov 2021 05:35 AM
The chilly start to November has a bit of despair to it as the oncoming winter season seems imminent and the upcoming time change will vanquish most sunshine from after work hours. The featured chart presents a comparison between the high temperature distribution for October vs November for Ames based on period of record data. The left hand plot maps equal quantiles, which allows for direct frequency comparisons between the two months. For example, a high temperature at or above 50 degrees during October is as common as having a high above 32 during November, yikes. The right plot and table shows the difference between the two months in the 14-18 degree range on average. Despite this doom and gloom, the near term forecast does has some hope for warmer weather later in the week and the return to something above average even for early November.
Voting: Good - 15 Bad - 0
Generate This Chart on Website
Thu Nov 04, 2021

2021 Severe Drought
04 Nov 2021 05:32 AM
The weekly update to the US Drought Monitor is due out later this morning and will provide an update on how effective last week's rainfall was at putting another dent in the drought situation that has plagued much of 2021. The featured map presents an IEM computed grid frequency of having at least D2 "Severe Drought" classification this year. The two epicenters of dryness this year are shown over northwestern Iowa and an area to the north and east of Ames to Waterloo. It is interesting to note that a good chunk of the state never reached D2 status this year. The weather this year has certainly been highly variable and that's reflected in the variability you see in this map analysis.
Voting: Good - 14 Bad - 1
Generate This Chart on Website
Fri Nov 05, 2021

November Temps + Winds
05 Nov 2021 05:34 AM
Very nice temperatures are expected for this upcoming weekend with highs well into the 60s for much of Iowa. These warm temperatures are expected with not much in the way of wind, which is atypical for such temperatures in November. The featured chart presents the frequency of having at least a 10 knot wind speed by the given air temperature for Des Moines during November. It is interesting to note how clear the signal is shown by the plot. Frequencies are about average until reaching 50 degrees and then increase all the way to near 100% around 75 degrees. Such warm temperatures imply strong lower atmospheric mixing, which brings down higher speed air aloft to the surface. A sort of self- fulfilling prophesy.
Voting: Good - 12 Bad - 0
Generate This Chart on Website
Mon Nov 08, 2021

Goodbye D2
08 Nov 2021 05:32 AM
The weekly update to the US Drought Monitor released last week removed the remaining "D2 Severe" classification of drought over the state. The significant rains of October helped put a large dent in the drought that has plagued much of 2021. The featured chart presents a time series of weekly drought coverage classification for the state over the past two years. Only for one week during this period was the entire state nearly covered by some drought category. It is never too early to start looking forward to how the lingering drought will progress over the cold season into next year's spring. Climatology does not offer much of significant rainfall totals over the cold season, but there is also not much demand for water outside of replenishing soil moisture reserves and area reservoir dams.
Voting: Good - 15 Bad - 0
Generate This Chart on Website
Tue Nov 09, 2021

First and Last 65
09 Nov 2021 05:33 AM
Monday kept the pleasant weather from this past weekend going for at least one more day with high temperatures into the 60s for much of the state. Ames topped out at 65 degrees. The featured chart presents the yearly period between the first spring and final fall season day with a high temperature of at least 65 degrees. The simple long term average for the fall date is just one day later than yesterday's value, so perhaps this was the last temperature as warm for the season. The near term forecast does not have any hope for such warm temperatures with even colder temperatures expected by the end of the week.
Voting: Good - 12 Bad - 0
Generate This Chart on Website
Wed Nov 10, 2021

Headline Frequency
10 Nov 2021 05:17 AM
The National Weather Service issues many different watch, warning, and advisory types to cover weather threats to life and property. These "headlines" are issued for counties or forecast zones or sometimes polygon areas. For the purposes of the featured chart, the most frequent 25 headline types are presented over the past four years for NWS Des Moines. The accounting for this presentation considers the number of counties lit up by each event. For example, a Fog Advisory covering 51 counties would count for 51 in this analysis. The Severe Thunderstorm Warning and Winter Weather Advisory are easily the top two headlines with the Fog Advisory third. You can generate this plot for other NWS Forecast Offices and year periods of your choice.
Voting: Good - 15 Bad - 1
Generate This Chart on Website
Thu Nov 11, 2021

Just 5 Degree Drop
11 Nov 2021 05:04 AM
The featured chart presents some metrics for the largest drop in season to date low temperature for Ames. The largest drop this year is a mere five degrees when the low temperature on 23 September reached 39 degrees after having a previous coldest value of 44 degrees. Please note that the algorithm for this chart uses the July data to begin accumulating a season to date coldest temperature, but does not include that month in the calculation of largest drop for the season. The left panel indicates that much larger drops are likely to occur with the simple average near 12 degrees. The two right panels show that larger drops occur later in the season when much colder temperatures are possible. During this time of year, relatively warm soil temperatures and soil moisture help to dampen large temperature drops. Later in the season, snow starts to show up and can very much help really plummet temperatures to set new season to date cold temperatures.
Voting: Good - 7 Bad - 1
Generate This Chart on Website
Fri Nov 12, 2021

Windy Thursday into Friday
12 Nov 2021 05:38 AM
The featured map presents an analysis of average wind speed for Thursday based on NWS Real Time Mesoscale Analysis (RTMA). Winds were howling on Thursday and have continued into Friday with the first powerful winter storm to affect the upper Midwest US. Snow is flying over parts of Iowa this morning with accumulations possible over some portions of northern Iowa. Larger amounts of snow along with blizzard conditions are expected over Minnesota, South and North Dakota. Welcome to winter!
Voting: Good - 19 Bad - 0
Generate This Chart on Website
Mon Nov 15, 2021

Nice Jump Up Coming
15 Nov 2021 05:41 AM
After a rather chilly weekend, temperatures are expected to rebound nicely today and then really soar on Tuesday well into the 60s. The present forecast would indicate this jump up in temperature to be a 15 degree jump after the maximum high over the previous four days to Tuesday being just 50 degrees. The featured chart presents the weekly largest and most negative drop in daily high temperature after the maximum high during those previous four days. Yeah, kind of tricky to explain. Anyway, such a jump up is in line with what's possible for this time of year and there is even some more room for it to be more extreme. Such swings are certainly much easier during the cold season as temperatures are more variable due to the strong influence of air masses.
Voting: Good - 10 Bad - 0
Generate This Chart on Website
Tue Nov 16, 2021

Location, Location, Location
16 Nov 2021 05:35 AM
Your location in the state made a big difference to the air temperature you felt Monday afternoon. The featured plot presents all available temperature observations from Iowa airport weather stations on Monday. A far southwestern Iowa site of Clarinda is highlighted along with a far northeastern site of Decorah. By mid afternoon, one site was at 65 degrees while the other was at 37 degrees. A similar temperature gradient orientation is expected today with far southwestern Iowa reaching the 70s, but far northeastern Iowa shouldn't be as far behind as on Monday.
Voting: Good - 21 Bad - 0
Wed Nov 17, 2021

Upcoming Roller-coaster
17 Nov 2021 05:33 AM
The featured chart is lifted from the venerable BUFKIT Warehouse website. It shows the combination of recent temperature observations from the Des Moines Airport along with a number of model forecast time series out the next seven days. The timestamps shown on the x-axis are in UTC / GMT time, so it is a value six hours ahead of our current CST timezone. The nice temperatures on Tuesday represent the high point in the roller-coaster ride with high temperatures this coming Monday shown to be barely above freezing! The website linked contains these graphics and more information if you are interested in forecasting the weather!
Voting: Good - 19 Bad - 0
Generate This Chart on Website
Thu Nov 18, 2021

Fall 2021 Precip Departures
18 Nov 2021 05:33 AM
If you define the fall season as starting on 1 September, the featured map presents IEM computed precipitation total departures from average for this fall season to date. While it has been a very wet fall for many in the state, not all locations are even above average for the period. The notable exception shown is Dubuque with a 1.79 inch negative departure due to a rather dry September. The caveat to the dry areas shown for this period is the amount of precipitation that fell during a very wet August. So the end result is that while drought conditions still due linger in the state, the effects felt during this time of the year are rather minimal with the growing season long over and nil evaporative demand due to cold-season temperatures.
Voting: Good - 9 Bad - 0
Generate This Chart on Website
Fri Nov 19, 2021

November Clear Skies by Temp
19 Nov 2021 05:32 AM
Much of Iowa received plenty of sunshine on Thursday, but a risk northwest wind and chilly temperatures made things feel very winter like. The combination of chilly temperatures and clear skies is the subject of today's featured chart. It presents the frequency of having reported clear skies by air temperature during November for Des Moines over all hours of the day. The presence of clear skies is not all that important to experience warm temperatures this time of year as frequencies only appear to marginally increase at the warmest temperatures. The reason is that solar heating isn't all that effective this time of year with limited daylight hours and ever decreasing incidence angle. The impact at below freezing temperatures (very likely overnight hours) is more evident with clear skies more common than not for temperatures well below freezing.
Voting: Good - 13 Bad - 0
Generate This Chart on Website
Mon Nov 22, 2021

November Daily Sunshine
22 Nov 2021 05:24 AM
Outside of the windy conditions, the weather this past weekend wasn't all that bad with sunshine and pleasant temperatures. The featured chart presents daily solar radiation totals from the ISU Soil Moisture station near Ames at the Ag Farm west of town. The daily total solar radiation values are presented along with a simple modeled maximum value based on latitude and date of the year. Three of the past four days have seen totals around the max, which would indicate sunny conditions for the day. The downward slope of the max value line is evident as each day features fewer total time of sunshine and a decreasing incidence angle.
Voting: Good - 11 Bad - 0
Generate This Chart on Website
Tue Nov 23, 2021

Few New Records This Year
23 Nov 2021 05:30 AM
With only a month and a week to go with the year 2021, it is a good time to start reviewing how things went! The featured chart presents the number of new daily records set for maximum high temperature, minimum low temperature, and precipitation. Ties are not included in this analysis. Each chart also contains a simple 365 divided by the number of years on record to the given year as an example model of how many records may be expected that year. The first few years are truncated on the y-axis as records are frequently set then with the limited period of record. Anyway, the totals shown for 2021 are rather few. Additionally, over the past 25 years or so, none of the years are shown above the simple model for new record low temperatures.
Voting: Good - 13 Bad - 1
Generate This Chart on Website
Wed Nov 24, 2021
Frozen Turkey
24 Nov 2021 05:03 AM
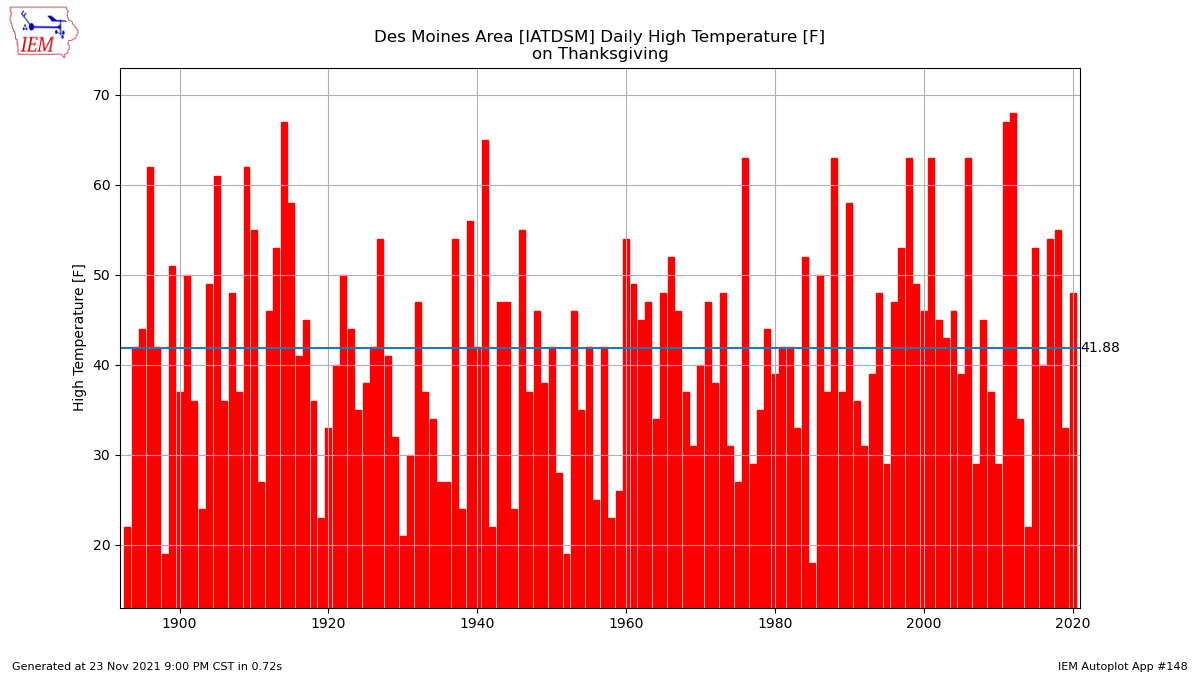
Warm temperatures were welcome over Iowa on Tuesday with record highs set at a few locations in western Iowa. Such nice temperatures will be swept out of the state during the day on Wednesday and we will be left with a cold Thanksgiving Day. The high temperature is expected to be at or just below freezing over much of the state. Having such cold on Thanksgiving isn't too out of the ordinary. The featured chart presents Thanksgiving Day high temperatures for Des Moines. Please note that such climatology can be tricky for sites that do not report values on the calendar day, but around 7 AM, so Des Moines was chosen as one of the sites that does do calendar day observations. Outside of the chilly temperatures, the weather will be excellent for travel otherwise with not much in the way of storms over the central US.
Voting: Good - 16 Bad - 2
Generate This Chart on Website
24 Nov 2021 05:03 AM
Warm temperatures were welcome over Iowa on Tuesday with record highs set at a few locations in western Iowa. Such nice temperatures will be swept out of the state during the day on Wednesday and we will be left with a cold Thanksgiving Day. The high temperature is expected to be at or just below freezing over much of the state. Having such cold on Thanksgiving isn't too out of the ordinary. The featured chart presents Thanksgiving Day high temperatures for Des Moines. Please note that such climatology can be tricky for sites that do not report values on the calendar day, but around 7 AM, so Des Moines was chosen as one of the sites that does do calendar day observations. Outside of the chilly temperatures, the weather will be excellent for travel otherwise with not much in the way of storms over the central US.
Voting: Good - 16 Bad - 2
Generate This Chart on Website
Mon Nov 29, 2021

November Hourly Wind Speeds
29 Nov 2021 05:21 AM
The featured chart presents a simple analysis of average wind speeds by hour of the day for Ames for three periods covering November and the first half of December. All three periods show a clear diurnal signal with peak speeds coincident with peak net heating of the day with rapid ramps up in the morning and down in the evening. The overall afternoon trend is for decreasing speeds as solar heating decreases, which decreases mixing, and weaker temperature gradients. You can generate this chart for a location of your choice and arbitrary time periods of your choice to make similar comparisons elsewhere.
Voting: Good - 12 Bad - 0
Generate This Chart on Website
Tue Nov 30, 2021

2021 Daily High Sigma Departures
30 Nov 2021 05:18 AM
Wow, what a treat the weather was on Monday in Iowa with very pleasant temperatures and even a record high temperature for Sioux City of 70 degrees set for the date. The featured chart presents daily high temperature departures this year for Sioux City expressed in terms of sigma (1 standard deviation). Such a term allows a somewhat fair comparison between temperature differences over the year as the departure gives a more representative distance away from the average based on variability for the given date. The chart shows that yesterday had the largest departure this year for the site when expressed in sigma. The near term forecast continues to advertise additional very warm days upcoming to start off December. Areas to our west may be in line to set all time record warm high temperatures during December even!
Voting: Good - 12 Bad - 0
Generate This Chart on Website