Past Features
This page lists out the IEM Daily Features for a month at a time. Features have been posted on most days since February 2002. List all feature titles.
Wed Sep 01, 2021

Monthly CDDs
01 Sep 2021 05:20 AM
We have somehow made it to the start of a new month, so it is a good time to look back on August! The featured chart presents monthly computed cooling degree day (CDD base 60°F) totals for Des Moines. This metric attempts to capture air conditioning demand with higher totals indicating more demand / warmer air temperatures. The total for this August came in above the previous month of July, which is a bit uncommon as shown by the chart back to 2002. Looking back on previous Septembers, we find plenty of accumulated CDDs and so we are by no means done with summer time warmth. The near term forecast though does have a taste of fall with very pleasant temperatures expected over the coming seven days.
Voting: Good - 8 Bad - 1
Tags: cdd
Generate This Chart on Website
Thu Sep 02, 2021

Newark, NJ Precipitation
02 Sep 2021 12:00 AM
The storm system that was Hurricane Ida, which pummeled Louisiana on Sunday, combined with a stationary frontal zone over the northeastern US on Wednesday evening and made for a flash flood disaster. The intense and sustained rainfall rates set all kinds of records for the area with the featured chart presenting hourly maximum precipitation reports for Newark, New Jersey. Two mind blowing aspects of the chart are the distance the new record value is above the second highest value and that the following hour is also found on the top 10 listing!
Voting: Good - 13 Bad - 0
Generate This Chart on Website
Fri Sep 03, 2021

20 inch Club
03 Sep 2021 05:34 AM
Based on preliminary data, the August precipitation total for Ionia (north of Waterloo) stands at 20.88 inches. Having a 20+ inch precipitation month is a rather rare feat in Iowa. The featured table presents a listing of the four other currently known 20+ inch monthly events. Please note that this list has been hand quality controlled as there are a couple of additional events found in the IEM / ACIS databases that look very suspect. The table also lists the largest single day (24 hour) precipitation total for that site and month. Getting one big daily rain certainly helps get that total to 20, but the Clio July 1993 maximum value of just 3.38 inches makes for a remarkable feat to reach 20 inches for the month.
Voting: Good - 17 Bad - 0
Tags: aug21
Mon Sep 06, 2021

Tornado + Flash Flood Emergency
06 Sep 2021 05:29 AM
The National Weather Service can place a special flag on both Tornado and Flash Flood Warnings to denote that they are emergency situations with an observed threat about to impact a populated location. A number of such emergencies were issued last week for post tropical storm Ida as it impacted the northeastern US. The Philadelphia NWS office had both a Tornado and Flash Flood Emergency active at the same time for Bucks County Pennsylvania. The featured table presents the IEM computed and unofficial instances whereby a given county was under a simultaneous Tornado and Flash Flood Emergency. The combination is very rare. The IEM has a page that lists out the emergency warning events.
Voting: Good - 6 Bad - 0
Tags: emergency
Tue Sep 07, 2021

Tracking Soil Water
07 Sep 2021 05:35 AM
The featured chart presents an IEM calculation of daily soil water change by assuming that the two observations at depths of 12 and 24 inches are representative of a 6 to 30 inch depth layer. As such, the reported volumetric soil moisture values can be converted to a water depth over that layer. The top panel plots the end of day soil water depth and the bottom panel shows the day to day change for Nashua (NE Iowa). There are a number of interesting things to be seen with this plot as it starts off during the beginning of August when things were really dry and the soil was likely close to its wilting point (~12%) and no day to day decrease in moisture. The big rains of August then came and recharged the water in this layer. The initial big shot of rain (5 inches!) soaked into the layer and then you can see a large negative value the next day as this water moved to lower depths that were dry as well. The steady drying each day is noticeable as plants uptake water and drainage occurs to deeper depths.
Voting: Good - 14 Bad - 1
Generate This Chart on Website
Wed Sep 08, 2021

Already Fall
08 Sep 2021 05:32 AM
A cold front swept the state clean of humid air on Tuesday and brought a definite fall like feel with brisk northwesterly winds. Are we already in the fall season? Depending on who you ask, the start of fall is either Sep 1, Labor Day, Sep 22, or some other arbitrary date. Since we like to feature statistical plots on this website, the featured chart presents the trailing 91 day average temperature for Ames. The maximum value plotted each year would represent the warmest consecutive 91 day period each year, which perhaps could be considered the actual summer season! The 2021 value appears to be set now with the peak on 2 September and not much chance of pulling that average higher over the coming days. The second panel displays some metrics with how this end of summer / start of fall date has changed over the years with a slight positive trend.
Voting: Good - 10 Bad - 0
Tags: fall
Generate This Chart on Website
Thu Sep 09, 2021

Des Moines vs Waterloo
09 Sep 2021 05:34 AM
The high temperature for Des Moines on Wednesday was 81 while the high for Waterloo was 77 making for a four degree difference. The featured chart presents the daily frequency of the Des Moines site being four degrees warmer than Waterloo for high temperature. A clear annual cycle is shown with the higher frequencies happening during the winter months. Waterloo typically has more snow cover than Des Moines, so that is part of the explanation for the higher frequencies during the winter months. During the warm season, the air masses are more homogeneous with temperature so horizontal gradients are decreased which explains some of the annual signal. Additionally, Waterloo has a sandier soil and some micro-climate effects along with being north and east of Des Moines, which places Waterloo in a cooler climatology. And finally, the Des Moines Airport has one of the strongest urban heat island effects in Iowa which help buoy temperatures there as well.
Voting: Good - 11 Bad - 0
Generate This Chart on Website
Fri Sep 10, 2021

95+ During September
10 Sep 2021 05:35 AM
The heat is on for the big football game in Ames on Saturday with the present forecast high temperature above 95 degrees. The featured chart presents the daily frequency of having at least a high temperature of 95 degrees during September for Ames. The overall average is just above 0.5 days, which implies a frequency of happening once every two years. In another week, the frequencies even get lower as 95 would be a record high for most of the days to end the month. Be sure to drink plenty of fluids if you are outside on Saturday enjoying the game! Go Cyclones!
Voting: Good - 17 Bad - 0
Generate This Chart on Website
Mon Sep 13, 2021

Summer 2021
13 Sep 2021 05:24 AM
NOAA made a press release late last week denoting that the summer months of June, July, and August were the warmest on record for the contiguous US. The asterisk to that record was that it was only 0.01 degrees F warmer than 1936 and thus within the margin of error for the estimated value. The featured chart shows how Iowa fared based on unofficial spatial estimates computed by the IEM. While the average temperature this year was above long term average, it was well shy of the Dust Bowl era years during the 1930s and many other years on record. September has gotten off to a warm start and the warm temperatures look to continue this week.
Voting: Good - 11 Bad - 11
Generate This Chart on Website
Tue Sep 14, 2021

Plenty of Time for 90s
14 Sep 2021 05:19 AM
With the calendar well into September, school back in session, and football season underway, only the shortening days seem to hint at the upcoming fall season with warm temperatures and humid conditions still present. The forecast even has temperatures back approaching 90 degrees for the coming weekend. The featured chart presents the latest calendar date for Ames having a high temperature of at least the given threshold. For 90 degrees, we still have about 3 to 4 weeks to go before those become above record high values and thus very unlikely. About the only temperature thresholds we can safely say "good-bye" to currently are 100 degrees and above!
Voting: Good - 12 Bad - 0
Generate This Chart on Website
Wed Sep 15, 2021

Severe Departure
15 Sep 2021 05:28 AM
The severe weather season is winding down as we continue into the fall season. The featured map presents IEM calculated departures from average for the number of Severe Thunderstorm Warnings issued per NWS forecast office vs a 2002-2020 average over the same year to date period. Negative values indicate fewer than average number of warnings issued. A clear east/west pattern is present over the contiguous US with a section of the northeast and dessert southwest being the most anomalously active. There is still plenty of time for additional severe weather over our area this year, but observed frequencies continue to decrease as temperatures cool, solar heating decreases, and surface moisture is less plentiful.
Voting: Good - 12 Bad - 0
Generate This Chart on Website
Thu Sep 16, 2021

Recent Down Months
16 Sep 2021 05:32 AM
The featured chart presents monthly precipitation departures for Ames along with El Nino 3.4 monthly index values. It is interesting to see all of the negative precipitation departures since the start of 2020 coinciding with the neutral to weak La Nina state. Substantial positive departures have not happened since the El Nino index was in positive territory. While El Nino / La Nina does help explain some of our weather over long periods of time, it is not the a direct relationship and often complicated by other larger scale oscillations in the global flow of heat and moisture. September has started off very dry as well, so the recent trend looks to continue.
Voting: Good - 11 Bad - 0
Generate This Chart on Website
Fri Sep 17, 2021

Severe Precip Contributions
17 Sep 2021 05:33 AM
An IEM Daily Feature earlier this week denoted the dearth of severe weather over Iowa and much of the Midwest US. Does the lack of severe weather imply a lack of precipitation as well? The featured chart uses one minute interval precipitation from the Des Moines airport and an archive of Severe Thunderstorm and Tornado Warnings to attempt to tease out an answer to this question. For the left two panels, periods when the airport was under a warning were totaled for precipitation along with an hour window around each warning (without another warning coincidentally active). The partitioning is shown with the legend denoting the overall precipitation total contribution. Roughly 10% of all precipitation falls during and close to these warnings. Individual years vary widely with some years near 20% contribution and others closer to a few percentage points. The right hand panel presents the frequency by minute accumulation that a warning was active. For example, when 0.10" of rain falls in a minute, there is either a tornado or severe thunderstorm warning active during 31% of these events. The relationship makes sense as more intense rainfall rates as typically associated with more intense convection.
Voting: Good - 12 Bad - 0
Tags: precip
Generate This Chart on Website
Mon Sep 20, 2021

Summer High Departures
20 Sep 2021 05:32 AM
High temperatures on Sunday felt more like mid summer than mid September. Needless to say that high temperatures were well above average with the featured graphic presenting daily high temperature departures from average for Ames since the first of June. The fourteen degree departure yesterday was the largest seen since mid June. A cold front on Monday will help make things feel more like fall for a few days until warmer temperatures are again expected for next weekend.
Voting: Good - 15 Bad - 0
Generate This Chart on Website
Tue Sep 21, 2021

Descent into Fall
21 Sep 2021 05:32 AM
A cold front swept the state clean of some muggy air on Monday and the next few days look like a delicious taste of fall weather with some very chilly overnight lows expected. The featured chart presents a look at season to date accumulated coldest low temperature for Ames since 1 July. The chart presents the climatology along with the actual observed 2021 value. This year has remained on the warm side of average, but with forecast lows near 40 degrees, we will quickly catch up to average for this time of year. This is also the time of year when we starting thinking about the first freeze as shown by the plotted range of values reaching 32 degrees around the middle of September. The agricultural crops planted on a reasonable date this spring should be in great maturity shape, so an early frost is not as big of a concern this year.
Voting: Good - 13 Bad - 0
Generate This Chart on Website
Wed Sep 22, 2021
Few Degree Day Worries
22 Sep 2021 05:34 AM
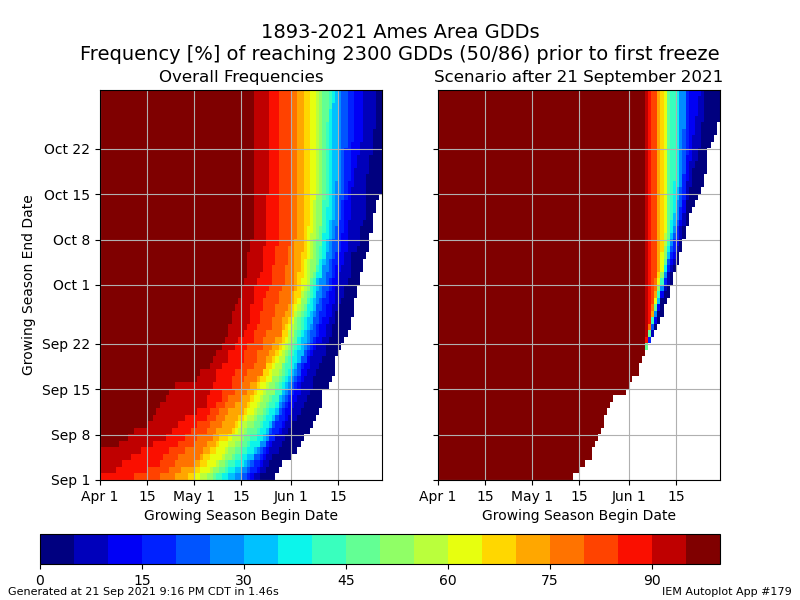
The featured chart presents probabilities of reaching 2300 Growing Degree Days (GDD) from a given start date (read planting date) to a given date in the fall. This amount of GDDs is a common maturity level for much of the corn grown in Iowa. The left panel presents the overall frequencies based on period of record data for Ames and the right panel is actual data this year up until 21 September with previous years providing scenarios after that. An early frost would seem not to be of concern this year with amble GDDs accumulated this year. The right plot indicates that planting dates up until the second week of June have reached maturity for this GDD level. After a few chilly days, the heat returns again for the weekend.
Voting: Good - 9 Bad - 0
Generate This Chart on Website
22 Sep 2021 05:34 AM
The featured chart presents probabilities of reaching 2300 Growing Degree Days (GDD) from a given start date (read planting date) to a given date in the fall. This amount of GDDs is a common maturity level for much of the corn grown in Iowa. The left panel presents the overall frequencies based on period of record data for Ames and the right panel is actual data this year up until 21 September with previous years providing scenarios after that. An early frost would seem not to be of concern this year with amble GDDs accumulated this year. The right plot indicates that planting dates up until the second week of June have reached maturity for this GDD level. After a few chilly days, the heat returns again for the weekend.
Voting: Good - 9 Bad - 0
Generate This Chart on Website
Thu Sep 23, 2021

Local Gradients
23 Sep 2021 12:06 AM
The most recent rainfall event on Monday evening very much frustrated residents of Ames as higher rainfall totals were had just outside of town in seemingly all directions! The same residents complained that this "missing out" has taken place most every time it rains this year. To test this hypothesis out, the featured map presents total precipitation estimates by the NOAA MRMS project for the year over the Story County (Ames) area. Sure enough, some of the lowest rainfall totals on the map can be found over Ames and Nevada with 5-7 inches higher totals found just a few miles north and south of the area! The meteorological reason behind this gradient remains elusive.
Voting: Good - 14 Bad - 0
Generate This Chart on Website
Fri Sep 24, 2021

September 80+
24 Sep 2021 05:35 AM
Daily high temperatures are rebounding after a few very crisp fall days this week with highs by the end of the weekend and into next week back into the 80s. We have seen more than our fair share of warm temperatures this September with the featured chart presenting the total number of hourly reports from the Ames Airport of at least a 80 degrees. The top panel shows the total each year during September and the bottom panel breaks it down by hour per day. Such warm temperatures are relegated to the daytime and early dusk hours as humidity levels and soil temperatures are not high enough to counter strong overnight cooling.
Voting: Good - 16 Bad - 3
Generate This Chart on Website
Mon Sep 27, 2021

Five Days of 80+
27 Sep 2021 05:23 AM
Temperatures were quite warm Sunday and even tied a daily high temperature record for Waterloo at 88 degrees. The present forecast has Sunday starting a five day stretch of daily high temperatures of at least 80 degrees for Des Moines. The featured chart presents the daily frequency of that day participating within a stretch of five consecutive days at or above 80 degrees for high temperature. Such streaks are not unheard of this time of year, but certainly not common and even less common as we get into October. So you will likely want to enjoy such warm temperatures as they last this week!
Voting: Good - 11 Bad - 0
Generate This Chart on Website
Tue Sep 28, 2021

Very warm for late September
28 Sep 2021 05:20 AM
Afternoon temperatures on Monday felt more like summer than fall with record highs set or tied at a number of locations in the state. The featured map presents an IEM computed last date for the 27 September and after period having as warm of a temperature as that observed on Monday. 30 Sep and 1 Oct 2019 appears for a number of sites, but for locations in central and southern Iowa had more exceptional temperatures with the most recent dates occurring back in the early 2000s and even 1997 for Ames and Des Moines. We'll have a few more very warm days until something closer to average happens with the start of October.
Voting: Good - 11 Bad - 0
Wed Sep 29, 2021

Daily Warning Counts
29 Sep 2021 05:06 AM
I suppose that after the most damaging severe thunderstorm complex ever to hit the US last year (10 Aug 2020 Derecho), having a rather quiet severe weather season this year evens things out. The featured graphic presents daily Severe Thunderstorm and Tornado Warning counts for NWS Des Moines this year. After pitching a shutout during April, May wasn't much more active and September has been very quiet as well. While the forecast at least has chances of rain included, not much in the way of severe weather is expected.
Voting: Good - 16 Bad - 0
Generate This Chart on Website
Thu Sep 30, 2021

HRRR Postage Stamps
30 Sep 2021 05:36 AM
The High Resolution Rapid Refresh (HRRR) weather forecast model is run by the NWS each hour and produces at least an eighteen hour forecast. Instead of looking at just a single deterministic forecast model run, weather forecasters like to look at ensembles of forecasts to provide probabilities and other statistical measures of forecast likelihood. Since the HRRR model is run every hour with at least hourly output available, one can create a time-lagged ensemble by stitching together the recent runs and looking at each run's forecast at a given valid time. The featured map does this stitching in "postage stamps" format with the top left box showing the actual RADAR mosaic presentation at 4 AM this morning and fifteen other boxes showing the most recent fifteen hourly runs of the HRRR model with that given run's forecast valid at 4 AM shown. While not explicitly forecast, the HRRR model produces a post-processed field that is meant to replicate a RADAR presentation. There's actually significant rainfall in the state this morning and each of the forecast runs shown some amount of storminess at this time. Consistency with the weather forecast over time from a given model provides forecasters with increased confidence that the forecast may be right! You can generate your own HRRR postage stamp plots for a location of your choice and historical date of your choice on this website! The plot takes a number of seconds to generate, so please be patient running the IEM Autoplot 221!
Voting: Good - 22 Bad - 0
Tags: hrrr
Generate This Chart on Website