IEM Daily Feature
Tuesday, 24 May 2022
Tuesday, 24 May 2022
Bias Correction Attempt
Posted: 24 May 2022 05:30 AM
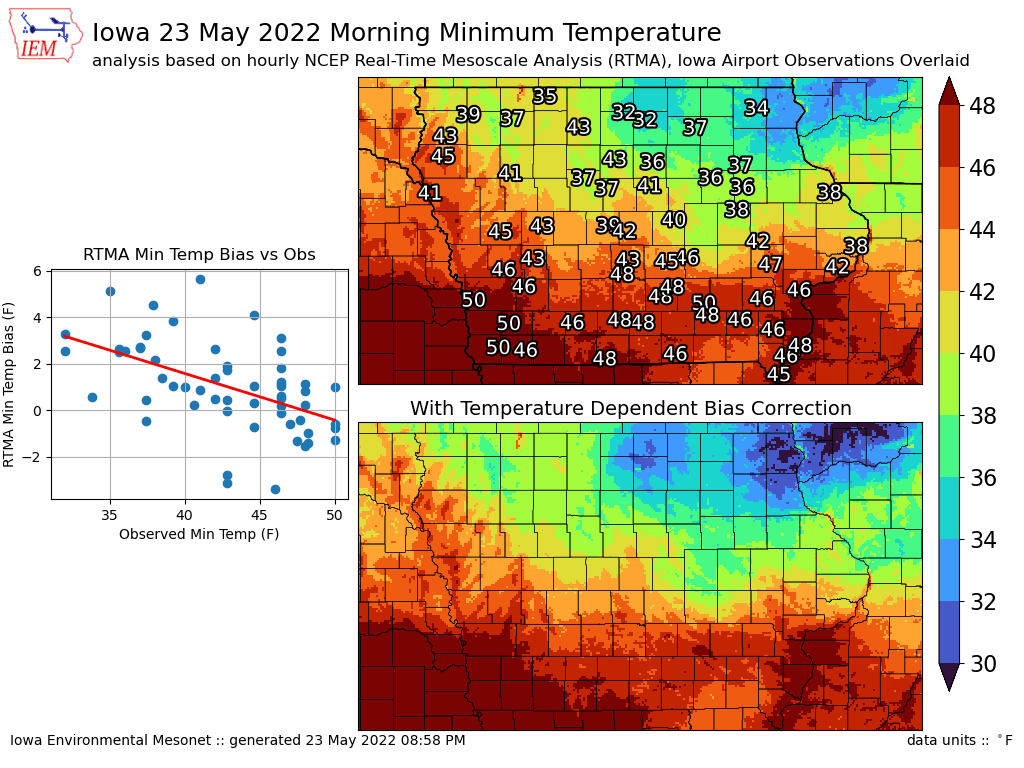
The featured maps + chart is a bit of a deep dive into investigating how cold it got Monday morning over
northern Iowa. A direct measurement of low temperature comes from the automated airport weather
stations, whose values are overlain on the top right map. The NWS has a number of different models
that attempt to produce high resolution analyses including the Real-Time Mesoscale Analysis (RTMA).
The RTMA is an hourly product with a value valid at the top of the hour. So the comparison of a RTMA
grid analysis of morning low temperature will be subject to at least two biases, 1) being the ability to
reproduce observations and 2) missing the low temperature due to sampling only once per hour vs
once per two minutes from the automated stations. Of course, the automated stations have sensor,
micro-climate, and other biases too. Putting all that aside, the left hand chart presents the RTMA grid
sampled value bias vs the observed min temperatures. A red linear fit line is generated and indicates
the RTMA has a warming bias with lower observed temperature. This makes some intuitive sense as
colder temperatures are likely more fleeting and thus more poorly sampled by the hourly RTMA. Ok,
we are in the home stretch here. So we take this red fit line and apply it as a temperature dependent
bias correction and arrive at the lower right map. You can see how this bias correction decreased the
analyzed lows over northeastern Iowa. So is the bottom map a better analysis then the top one?
Regardless, it certainly got chilly Monday morning with some frost likely nipping sensitive plants in the
area.
Voting:
Good = 9
Bad = 0
Voting:
Good = 9
Bad = 0