IEM Daily Feature
Friday, 05 March 2021
Friday, 05 March 2021
180 Day High Temperature
Posted: 05 Mar 2021 05:35 AM

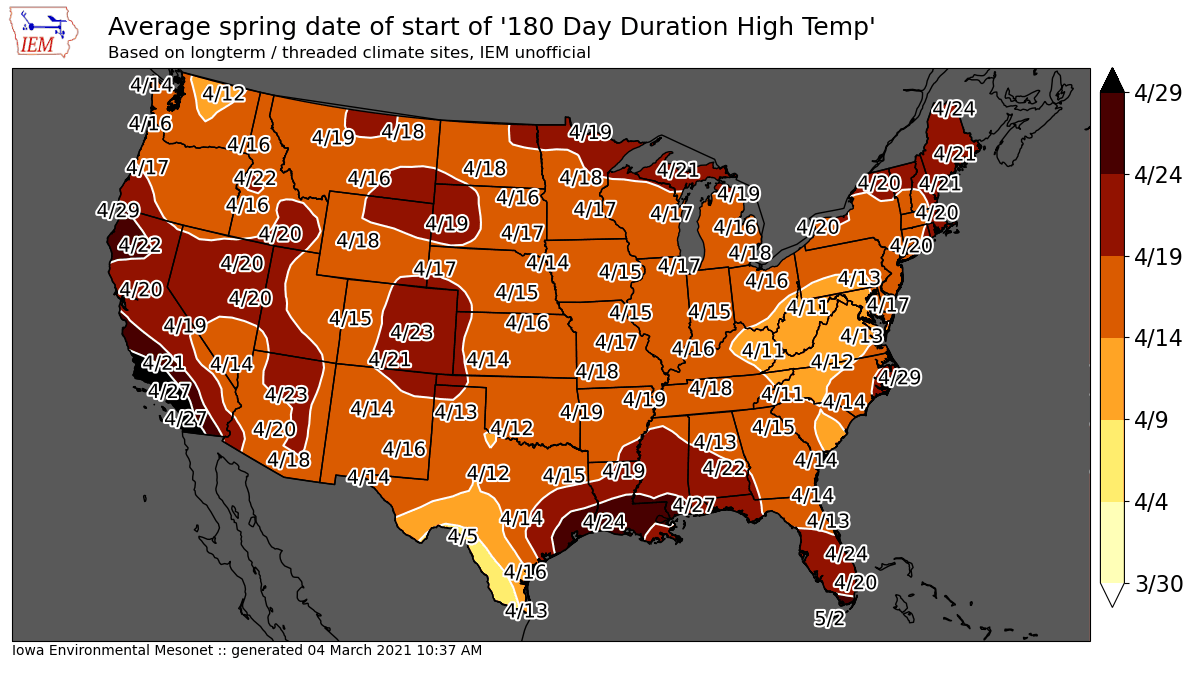
The featured map is a bit of an academic thought experiment. The question at hand is what high
temperature should feel warm and be likely confined to the warm half of the year? For example, some
Iowa locations saw 60 degree high temperatures and consider that warm, but such values are not
uncommon during the cold season. The map presents the high temperature at which about 180 days
separate the average first spring and average last fall date. This half year period is thus a proxy to
the "warm half" of the year. Rewording and taking the ~80 degree temperature value shown for Des
Moines. On average, the first 80 degree high temperature of the year denotes the start period of the
warmest half of the year. Of course, an individual year's data may not replicate that simple logic. For
example, March 2012 had many days in the 80s. The map does present a nice means for
comparable values over the US. Getting back to the 60 degree readings this week, over some parts
of the country, such values would be considered "warm" for their location!
Voting:
Good = 16
Bad = 1
Additional maps exist for the average spring date and fall date of the temperatures shown on this map.
Voting:
Good = 16
Bad = 1