IEM Daily Feature
Tuesday, 13 June 2017
Tuesday, 13 June 2017
Variability since Last Quarter Inch
Posted: 13 Jun 2017 05:24 AM
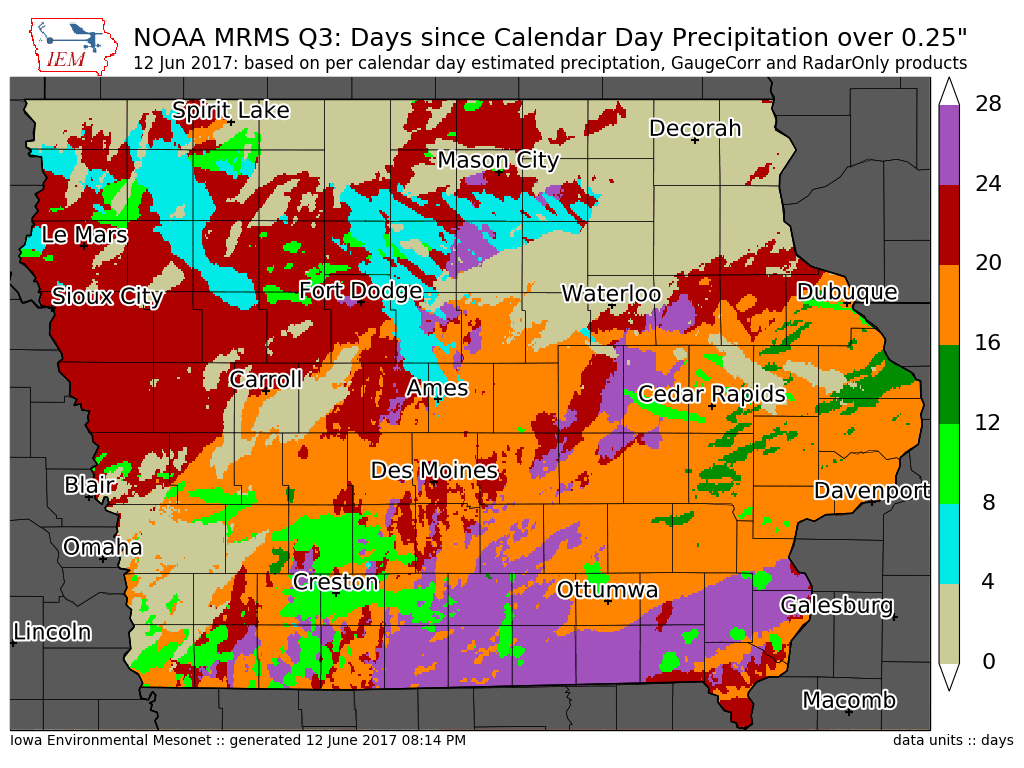
Rain totals over the state on Monday were a bit more widespread than what we have recently
seen, but plenty of locations missed out again. The featured map presents an analysis of the
number of days since the last calendar day 0.25+ inch precipitation total based on NOAA
MRMS estimates. Most of the light gray area depicted on the map was Monday's rainfall. The
purple areas represent between 24 and 28 days, so almost a month's worth of time. Rain
chances continue this week, but it remains to be seen of how widespread the storms are.
Voting:
Good = 13
Bad = 0
Voting:
Good = 13
Bad = 0