Plot Description:
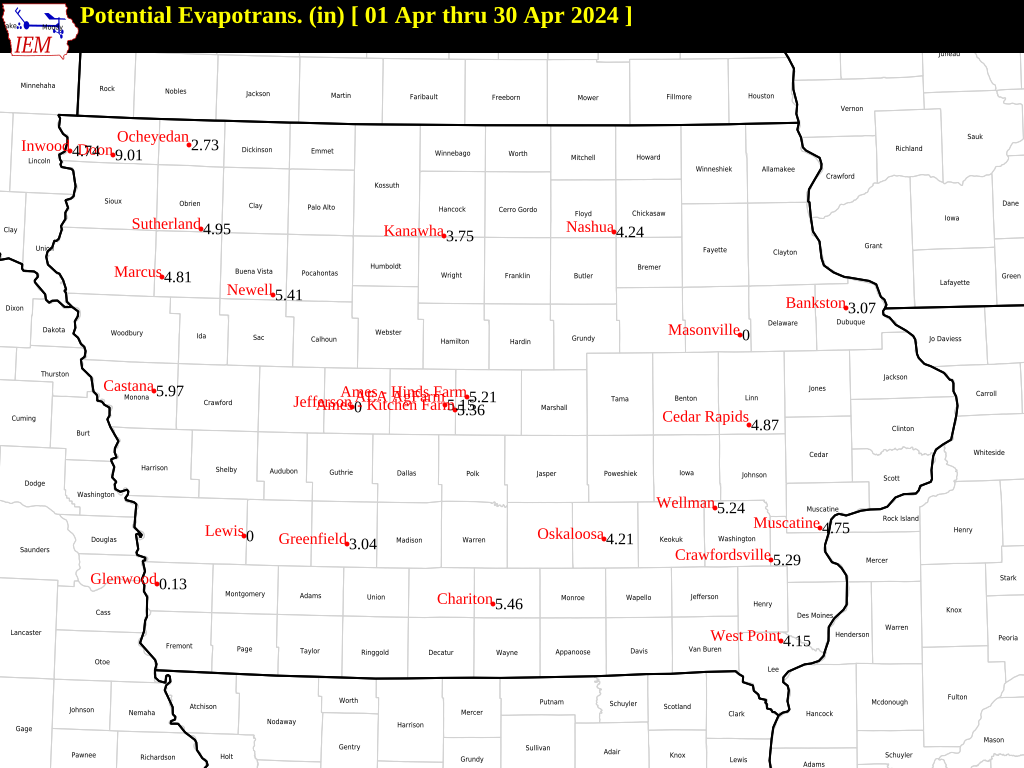
Monthly total of daily maximum potential evapotranspiration. The
daily value is calculated via a Penman formulation with a crop
coefficient of 1. The value would be a theoretical maximum.
QC Flags:
| M |
the data is missing |
| E |
An instrument may be flagged until repaired |
| R |
Estimate based on weighted linear regression from surrounding stations |
| e |
We are not confident of the estimate |
|
|
Yesterday values: |
|
|
|
Accumulated values: |
|
|
|
Data Applications: |
|
|
|
Data Request: |
|
|
|